

October 9, 2026
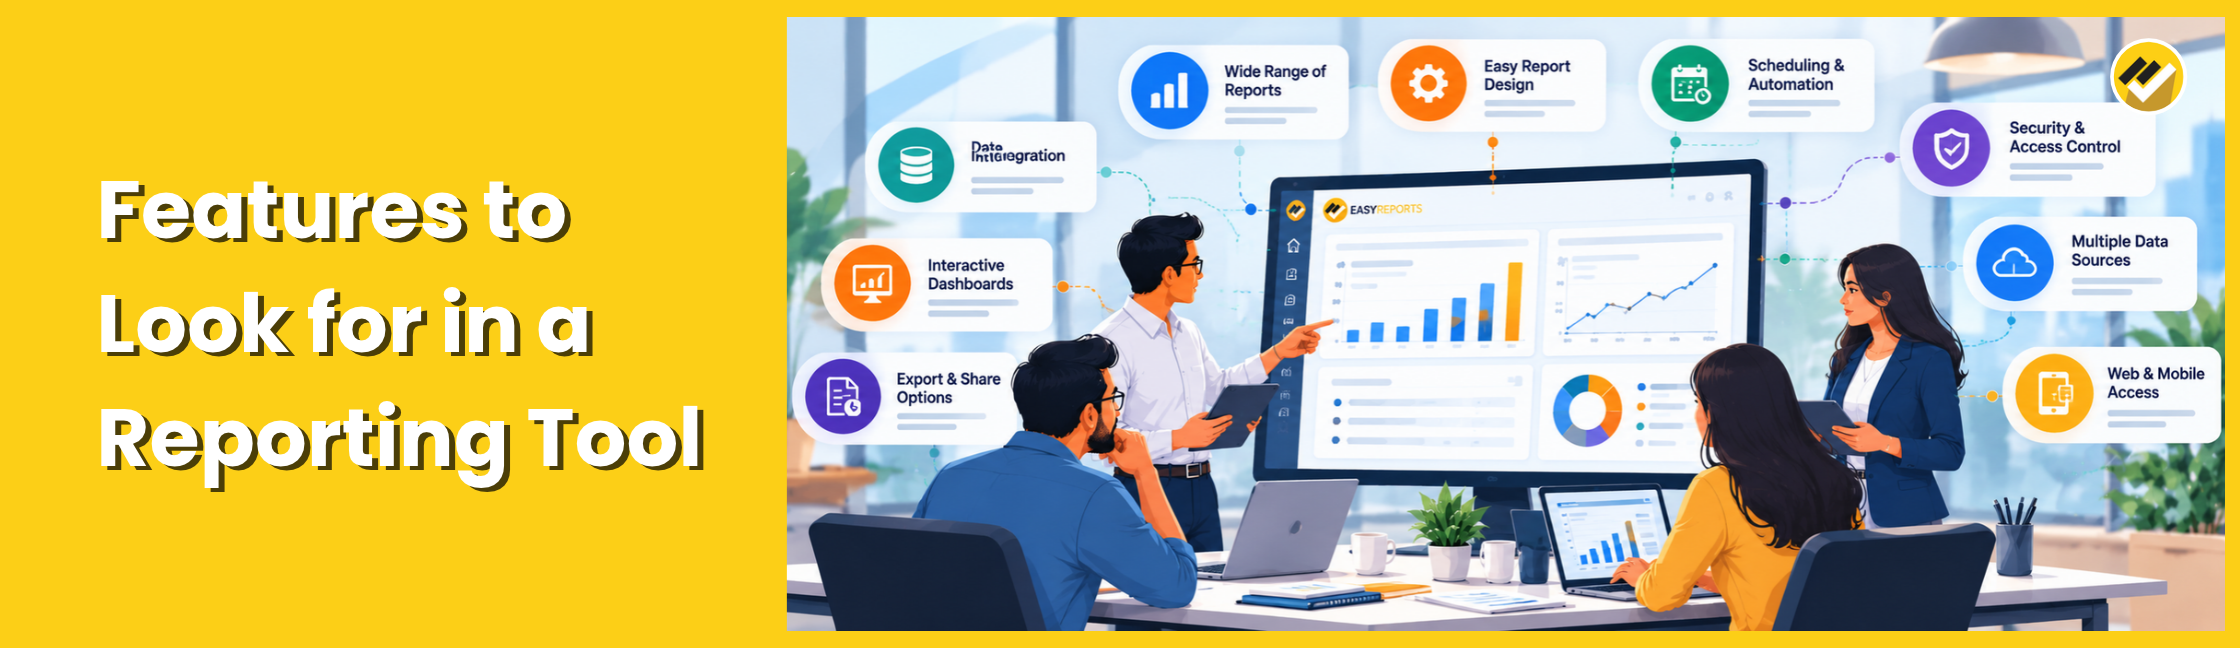
Choosing a reporting tool requires more than comparing dashboards and charts. The right reporting tool should connect with your business data, simplify report creation, automate repetitive tasks, protect sensitive information and deliver the right information to the right users.
However, not every business needs the same combination of features. A finance team may prioritize structured financial reports and auditability, while a sales team may need dashboards, filters and frequent updates. The best reporting tool should match the way your business collects, analyzes and shares information.
What Features Should a Reporting Tool Have?
Let’s look at each feature and why it matters.
1. Support for Multiple Data Sources
A reporting tool should connect to ERP’s, different databases and data sources so businesses can create reports and dashboards using the information they need.
Look for support for:
- ERP and other business data: Combine data from supported ERP systems and other business applications.
- SQL Server: Connect to Microsoft SQL Server databases.
- Oracle Database: Access and report on Oracle database data.
- MySQL: Create reports and dashboards using MySQL data.
- PostgreSQL: Connect to PostgreSQL databases.
- Reusable data models: Create data models and reuse them across multiple reports and dashboards.
EasyReports supports connectivity with SQL Server, Oracle, MySQL, PostgreSQL and other data sources. It allows users to define database connections, create data models using SQL and reuse those models to build different reports and dashboards.
2. Custom Report Design
Businesses rarely use identical reporting formats.
A standard sales report may show enough information for one company but fail to answer another company’s questions. Your reporting tool should allow you to adapt reports to your business requirements.
For example, a sales manager may need sales by salesperson, customer and product, while the finance team may need a detailed receivables report.
A flexible reporting tool lets each team work with information in a format that supports its responsibilities.
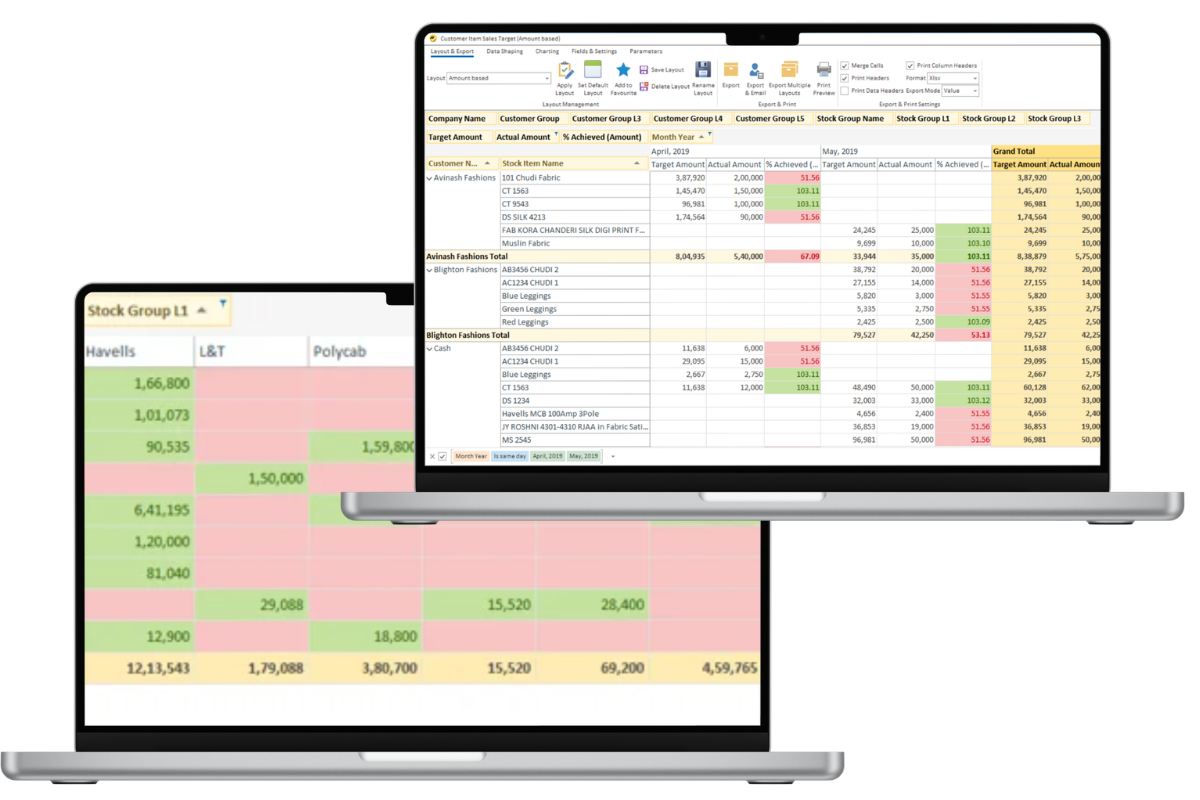
EasyReports supports customizable pivot, grid, spreadsheet and PDF reports, allowing businesses to create different reporting layouts for different requirements
3. Zero-Code Report Development
A reporting tool should allow businesses to create and customize reports without writing extensive code for every reporting requirement.
Zero-code report development helps business users design reports and modify layouts using visual tools rather than relying on developers for every change.
Look for features such as:
- Drag-and-drop report design
- Customizable report layouts
- Flexible filters and data views
- Reusable data models
- Easy report modification
- Dashboard customization
EasyReports provides a drag-and-drop report designer and reusable data models, allowing users to create and customize reporting layouts without writing code for every report interface.
Example
A sales manager needs to view sales by salesperson, customer and product. With a drag-and-drop report designer, the team can customize the report layout to display the required information without developing a new reporting interface from scratch.
By choosing a reporting tool with zero-code report development capabilities, businesses can simplify report customization and reduce their dependency on technical teams for routine reporting changes.
4. Dashboards and Data Visualization
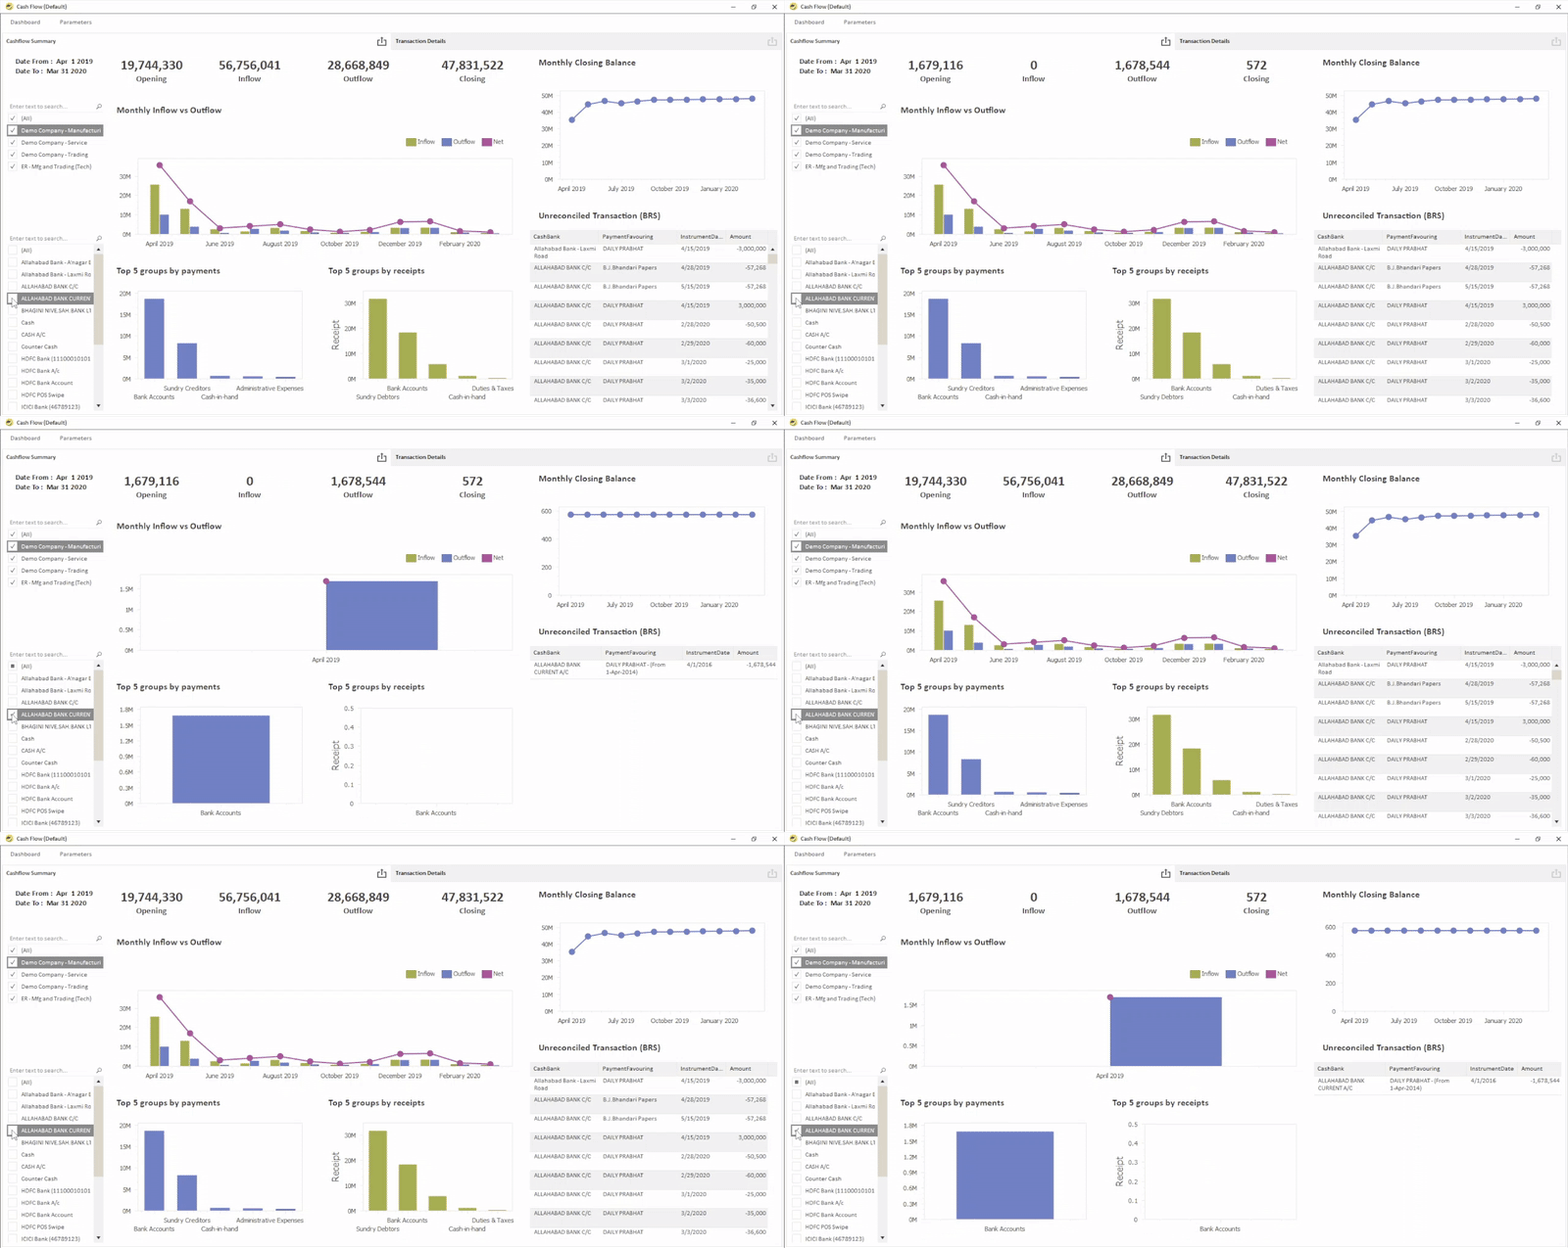
Dashboards help users understand important business information quickly and monitor performance through visual reports.
A reporting tool should provide suitable visualization options and drag-and-drop report and dashboard building capabilities, allowing users to create and customize reports according to their business requirements.
Depending on the reporting needs, look for:
- KPI cards
- Charts and graphs
- Tables and pivot reports
- Trend analysis
- Comparative views
- Interactive dashboards
- Drag-and-drop report design
- Drag-and-drop dashboard building
- Customizable layouts and data views
EasyReports provides drag-and-drop report and dashboard design capabilities, allowing users to build and customize reporting layouts to suit their business requirements.
Example
A sales manager wants to monitor revenue, salesperson performance and monthly sales trends on one dashboard. With drag-and-drop building capabilities, the team can arrange relevant reports and visual elements into a dashboard that presents the required information clearly.
By choosing a reporting tool with flexible visualization and drag-and-drop design, businesses can make reports easier to understand and adapt dashboards to changing reporting needs.
5. Report Scheduling and Distribution
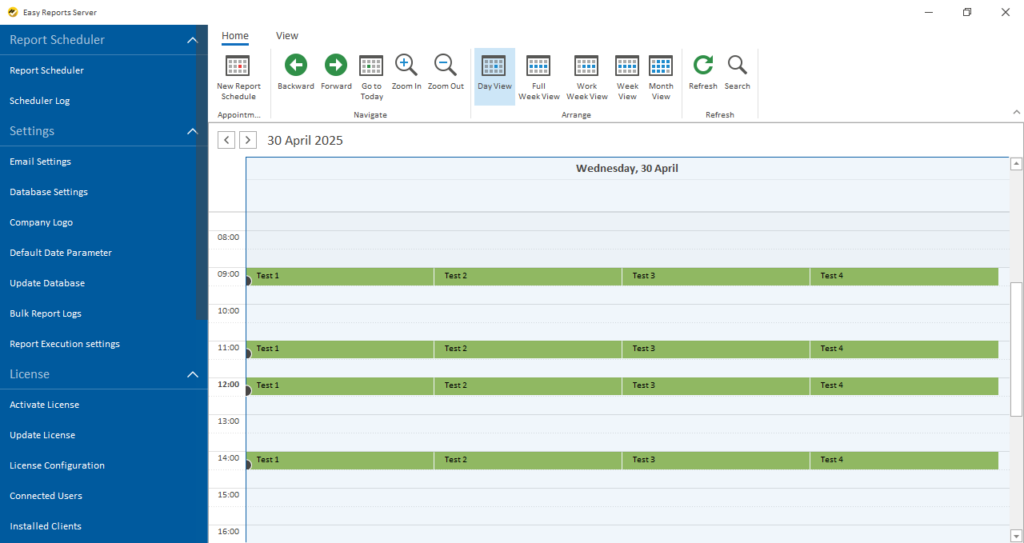
Creating a report is only one part of reporting. The right users also need to receive the report at the right time.
For example, a business may configure:
Daily: Sales summary
Weekly: Outstanding receivables
Monthly: Management MIS
Month-end: Financial reports
EasyReports supports report scheduling and automated email delivery, which can help businesses move recurring report distribution away from manual processes.
6. On-Premise Deployment and Data Security
A reporting tool should help businesses protect sensitive financial, customer and operational data. On-premise deployment allows businesses to keep their reporting system and data within their own infrastructure, giving them greater control over data access and security settings.
When evaluating a reporting tool, look for:
- On-premise deployment: Keep data within your organization’s infrastructure.
- Data security and control: Manage data access and security settings according to your internal policies.
- User-wise data filtration: Control which information different users can access.
- Permission management: Restrict access to sensitive reports based on user roles.
- Controlled report sharing: Ensure users access and share reports according to authorized permissions.
EasyReports supports on-premise and private-cloud implementation, allowing organizations to keep their data and security settings under their own control.
Example
A company may handle financial reports, customer details and sales performance data within its internal systems. By choosing an on-premise reporting tool, the company can keep its reporting environment within its own infrastructure while controlling user access to sensitive information.
Before selecting a reporting tool, check whether its deployment options and access controls meet your organization’s data security requirements.
How EasyReports Supports These Reporting Requirements
The right reporting tool should match the problems you identified before selecting the software.
EasyReports provides reporting and MIS automation for ERP environments including Tally, Microsoft NAV, SAP B1 and Dynamics 365. Its documented capabilities include dashboards, multiple report formats, report scheduling, consolidated reporting, user-wise data filtration and Excel and Google Sheets integration.
The platform also supports pivot, grid, spreadsheet and PDF reports and provides report-design capabilities using data models, SQL and drag-and-drop functionality. This makes EasyReports relevant for businesses that want to bring ERP reporting, management reporting and reporting automation into one reporting environment.
When comparing reporting software, focus on the features that affect your actual reporting workflow:
Data integration → customization → automation → dashboards → data freshness → security → scheduling → distribution → scalability.
Get your demo now with EasyReports!
Frequently Asked Questions
1. What features should a reporting tool have?
A reporting tool should offer data integration, custom reports, dashboards, automation, scheduling and data security.
2. How do I choose the right reporting tool for my business?
Compare data connectivity, customization, automation, security and deployment options based on your business needs.
3. Can a reporting tool connect to multiple databases?
Yes, some reporting tools connect to SQL Server, Oracle, MySQL and PostgreSQL, depending on supported integrations.
4. How does zero-code report development help businesses?
It allows users to create and customize reports visually, reducing dependence on developers for routine changes.
5. Why are dashboards important in reporting software?
Dashboards display KPIs, charts and trends in one place, helping managers monitor business performance quickly.
6. Can reporting software automate report distribution?
Yes, scheduling features can automate report generation and delivery at configured intervals.
7. Is on-premise reporting software more secure than cloud-based software?
Not necessarily. Security depends on access controls, configuration, maintenance and monitoring, as well as deployment type.
8. What should businesses check before purchasing reporting software?
Evaluate integrations, customization, dashboards, automation, security, deployment options and scalability.