EasyReports makes your reporting Faster & Smarter.
Try it for Free!

Sales Reporting, Analytics & Dashboards

EasyReports helps businesses explore sales reporting to track performance, analyze customers and products, monitor targets, and identify sales opportunities. Sales analytics and dashboards help teams understand trends, compare performance, and make better decisions.
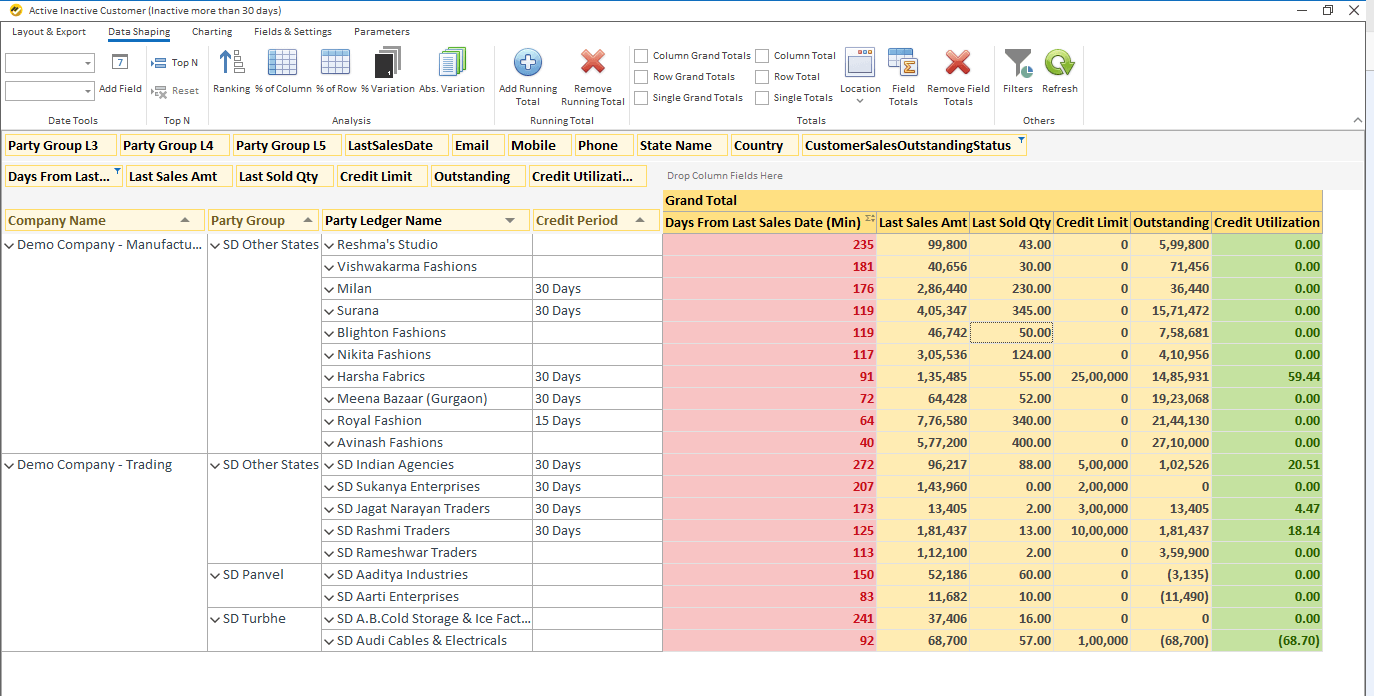
Lost Customer Tracking

Lost Customer Tracking

Losing customer has direct impact on growth of company, so keep a track on them to ensure timely actions are taken.

  • Identify customers before they are lost.
  • Track lost customers.
  • Salesperson wise lost customer listing
  • Outstanding of lost customers
Target vs Actual

Sales Analytics

Analyse sales trend to understand the market dynamic and accordingly decide on the sales and marketing strategies.

  • Highlights cross selling opportunities.
  • Analysis by customer and item
  • Monthly, Quarterly, yearly analysis with variances
  • Salesperson wise analysis
  • Sales vs Return analysis
  • Trend analysis – Star products, least selling products
Target vs Actual

Sales Target vs Actual

Keep track on salesperson’s performance by analysing the target achievement over a particular time period.

  • Track Salesperson’s target achievements
  • Pre-built option to maintain targets at salesperson, customer or item level.
  • Monthly, Quarterly, yearly analysis with variances
  • Identify salesperson not achieving targets.
Sales Summary Dashboard

Sales Dashboard

Get a clear view of sales performance across different dimensions with an easy-to-use sales dashboard.


  • Management dashboard for top level view
  • Sales trends
  • Top selling items
  • Bottom selling items
  • Analyse by salesperson, customer, item, month, quarter, year etc.