

August 28, 2026
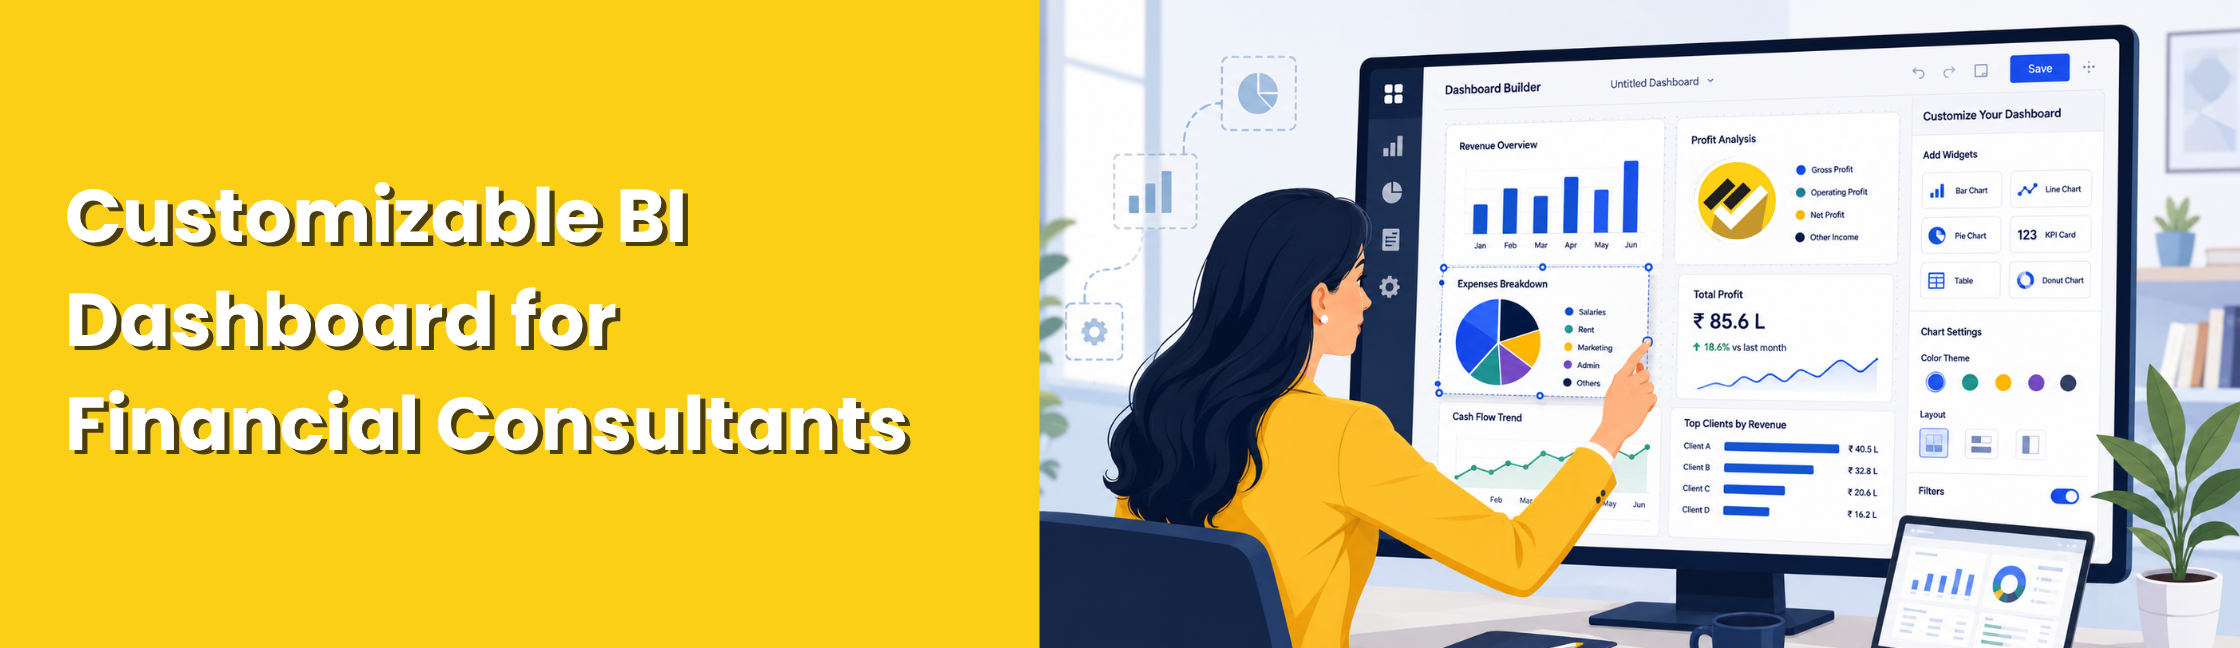
A customizable BI dashboard tool for financial consultants should offer customizable dashboards and financial reports, drill-down analysis, ERP and database connectivity, multi-company reporting, Budget vs. Actual analysis, cash flow and working capital visibility, receivables and payables tracking, financial ratio analysis and automated report scheduling and distribution.
Financial consultants often work with different clients, reporting formats, financial KPIs and data sources. A dashboard that works for one client may not work for another.
That is why choosing a BI dashboard tool is not just about finding attractive charts. The right tool should let you customize financial reports, connect to the required data, analyze performance, and automate recurring reporting.
But how do you know whether a BI dashboard tool can actually handle these requirements? The following factors can help you decide.
What Should Financial Consultants Look for in a BI Dashboard Tool?
A good BI dashboard tool for financial consultants should provide:
- Customizable dashboards and reports
- Financial reporting capabilities
- Easy access to detailed data
- ERP and database connectivity
- Multi-company or multi-entity reporting
- Budget vs. actual analysis
- Cash flow and working capital visibility
These features matter because consultants need to adapt reporting to different clients without repeating the same manual work.
1. Start with BI Dashboard Customization
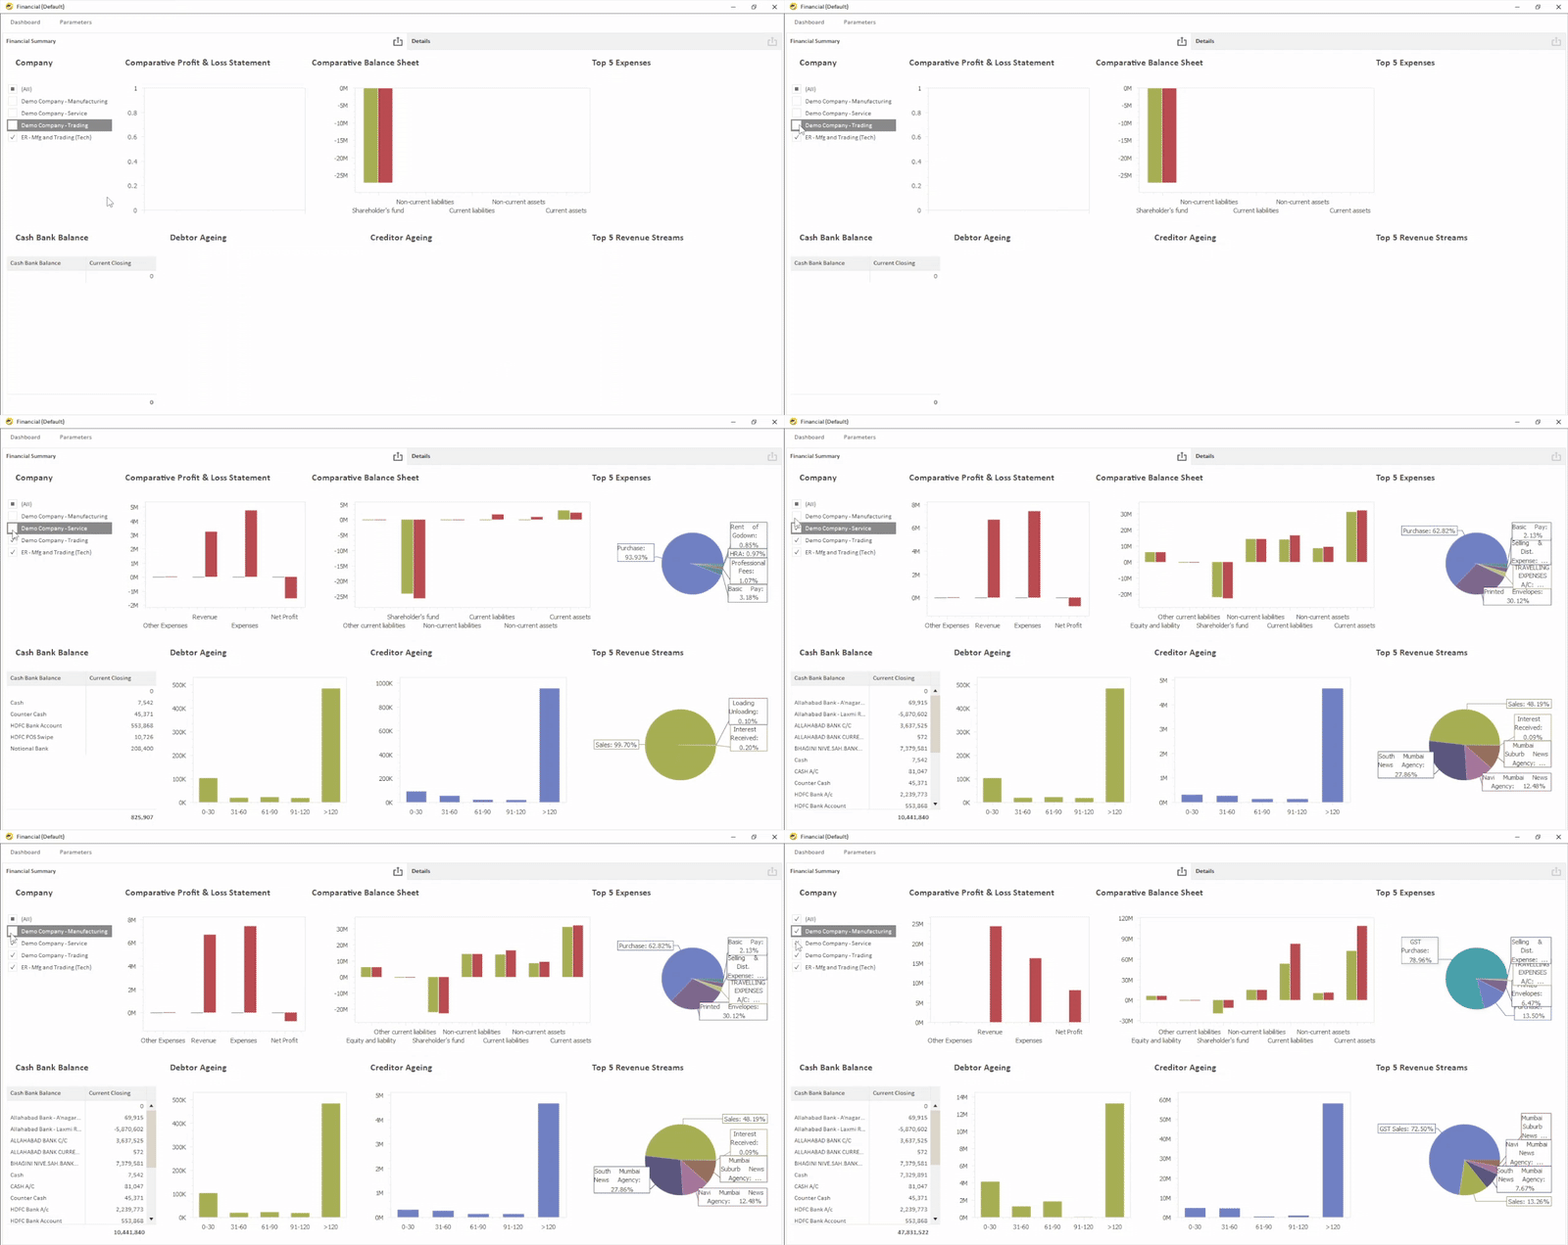
Every client has different reporting requirements. One may focus on profitability, while another may need better visibility into receivables, cash flow, budgets, or cost centres.
So, the first question to ask is:
Can I customize the dashboard around each client’s requirements?
Look for the ability to:
- Select relevant KPIs
- Change dashboard layouts
- Apply filters
- Add reporting dimensions
- Create different views
The dashboard also needs to connect with the financial reports behind those KPIs.
2. Check the Financial Reporting Capabilities
A dashboard can show that profit has declined, but a consultant may still need to understand why.
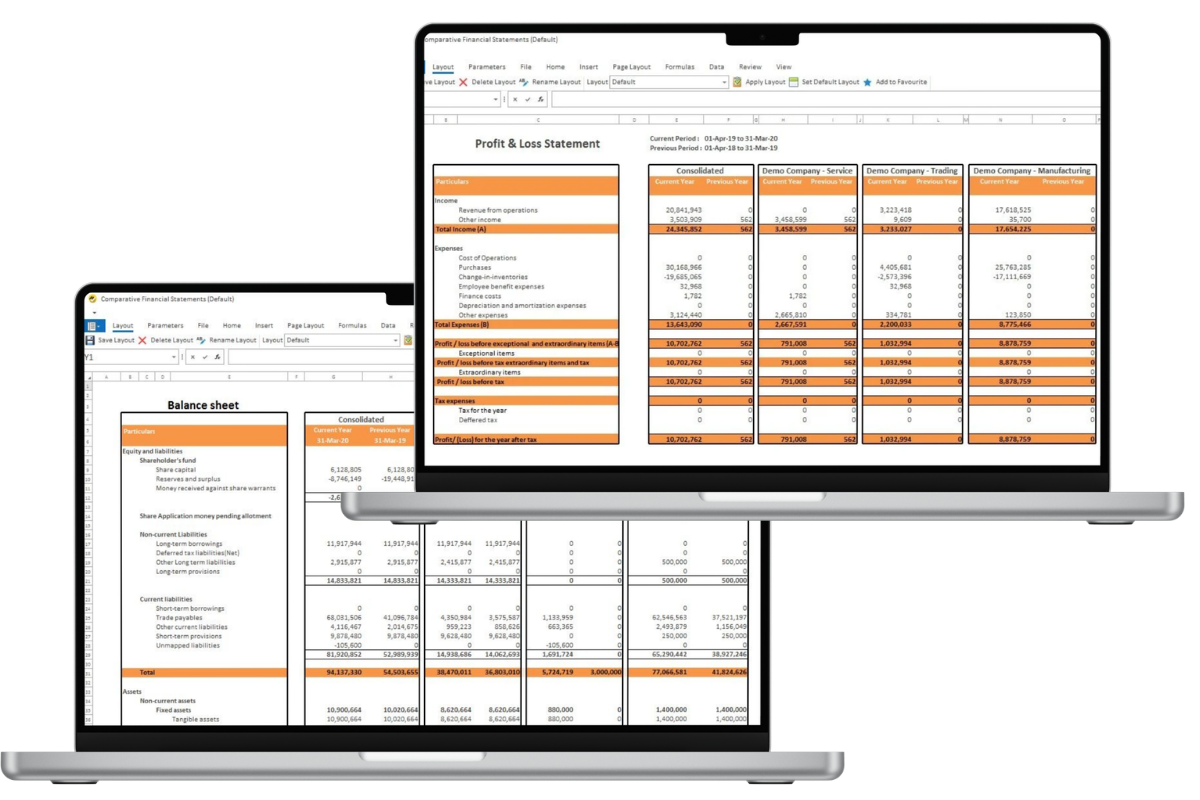
That means the BI tool should support detailed financial reporting alongside dashboards. Look for reports such as:
- Profit & Loss
- Balance Sheet
- Cash Flow
- Receivables & Payables
- Cost Centre reports
- Budget vs. Actual
- Financial ratio analysis
3. Look for Drill-Down in a Financial BI Dashboard
Financial consultants often need to investigate a number after seeing it on a dashboard. For example:
Profit → Business Unit → Customer → Transaction
Or Expenses → Cost Centre → Ledger → Transaction
So, when comparing BI dashboard tools, check whether they provide:
- Filters
- Drill-down
- Comparative reports
- Transaction-level details
- Different reporting dimensions
This helps consultants answer the next question without creating another spreadsheet & that brings us to an equally important consideration: where does the financial data come from?
4. Check Budget vs. Actual Analysis
A useful financial dashboard should help answer: Are actual results matching the budget?
Look for:
- Monthly budgets
- Quarterly budgets
- Yearly budgets
- Actual vs. budget comparison
- Variation analysis
- Ledger-level budgets
- Cost-centre-level budgets
This moves the reporting conversation from: “What happened?” to “What happened compared with what we planned?”
Once you understand the variance, the next financial question is often about cash.
5. Make Cash Flow and Working Capital Part of the Dashboard
Profit does not always tell the full financial story. A business may be profitable and still face pressure because customers have not paid or supplier payments are due.
That is why financial consultants should also consider:
- Customer receivables
- Supplier payables
- Upcoming payments
- Upcoming receipts
- Overdue collections
- Cash payments and receipts
- Non-moving inventory
For a financial consultant, that broader view can be more useful than looking at profitability alone.
What Financial Reports Should a Consultant Have in a BI Dashboard?
The exact reports depend on the client, but a practical financial dashboard can include:
- P&L: Track revenue, expenses and profitability.
- Balance Sheet: Review the financial position.
- Cash Flow: Understand cash movement.
- Budget vs. Actual: Identify financial variations.
- Receivables: Monitor outstanding customer balances.
- Payables: Track supplier obligations.
- Working Capital: Monitor short-term financial requirements.
- Financial Ratios: Identify performance trends.
- Cost Centre Reports: Analyze performance by department, project or business area.
How EasyReports Can Help Financial Consultants with BI Dashboards
A financial consultant needs more than a dashboard that displays numbers. The real value comes from connecting financial data, reporting, analysis and automation in one workflow.
That is where EasyReports can fit into the reporting process.
EasyReports: Build a Strong Financial Reporting Foundation
EasyReports supports formatted financial statements in PDF and Excel, along with predefined rules that can map ledgers to reporting heads. Consultants can also maintain mapping at the ledger, group, entity or entity-group level. But once the numbers are organized, the next question is, are they meeting the plan?
See Where Actuals Stand Against the Plan
EasyReports supports monthly, quarterly and yearly budgets, along with variation analysis against actual results. Budgets can also be maintained at ledger and cost-centre levels.
This helps consultants move beyond reporting what happened to identifying where performance is above or below expectations & when a variance appears, the next question naturally becomes, what does it mean for cash?
Know What Is Coming into and Going Out
EasyReports supports upcoming vendor payments, customer receipts, recurring payments and receipts, and cash payments and receipts as part of its Cash Flow / Fund Flow Management capabilities.
That gives consultants a clearer view of expected cash movements. But cash visibility alone does not tell the complete working-capital story.
Find the Working-Capital Pressure Points
EasyReports helps monitor customer receivables, supplier payables, overdue payments and receipts, non-moving inventory, increasing customer payment days and over-utilized credit limits.
Bring the Financial Picture Together
The real advantage comes when these areas work together rather than sitting in separate spreadsheets and reports.
Financial Statements → Budget Analysis → Cash Flow → Working Capital → Management Dashboard
This gives financial consultants a connected reporting workflow, from understanding the numbers to identifying variances, monitoring cash and highlighting areas that need attention.
That is what makes EasyReports relevant when choosing a customizable BI dashboard tool for financial consulting: it supports the financial reporting process behind the dashboard, not just the visual layer.
Explore EasyReports Discover how EasyReports can simplify financial reporting, dashboards, MIS and reporting automation.
Get a Free Demo See how EasyReports can fit your financial consulting and client reporting requirements.
FAQs
What should financial consultants look for in a BI dashboard tool?
Look for customization, financial reporting, data connectivity, analysis and automation.
Why is dashboard customization important for financial consultants?
It helps consultants adapt dashboards to different client KPIs and reporting needs.
What financial reports should a BI dashboard include?
Key reports include P&L, Balance Sheet, Cash Flow, Budget vs. Actual, Receivables and Payables.
Why is Budget vs. Actual analysis important?
It helps consultants compare planned performance with actual results and identify variances.
How can a BI dashboard help with cash flow?
It helps track expected receipts, upcoming payments, cash inflows and cash outflows.
Why is working capital important in financial reporting?
It helps identify overdue receivables, supplier payables, payment delays and funds tied up in inventory.
Can EasyReports support financial reporting for consultants?
Yes. EasyReports supports financial statements, budget analysis, cash flow and working-capital reporting.
Can EasyReports help automate financial reporting?
Yes. EasyReports supports report scheduling and automated report distribution.