EasyReports makes your reporting Faster & Smarter.
Try it for Free!

Dashboards

Our dashboards help you to view and interact with information on a single screen with filtering, drill-down and more. With visual and tabular widgets combined with a drag and drop and zero code designer our dashboards will help you get information at your fingertips

Financial Summary Dashboard

Dashboards

  • Simple drag and drop designer
  • Intuitive data visualization with multiple charts and tabular data
  • Filter, drill down, interactivity built in
  • View and analyze data from multiple sources
  • Single screen analysis for CEO, CFO and managers
  • Financial, Sales, Debtors, Expense and other dashboards
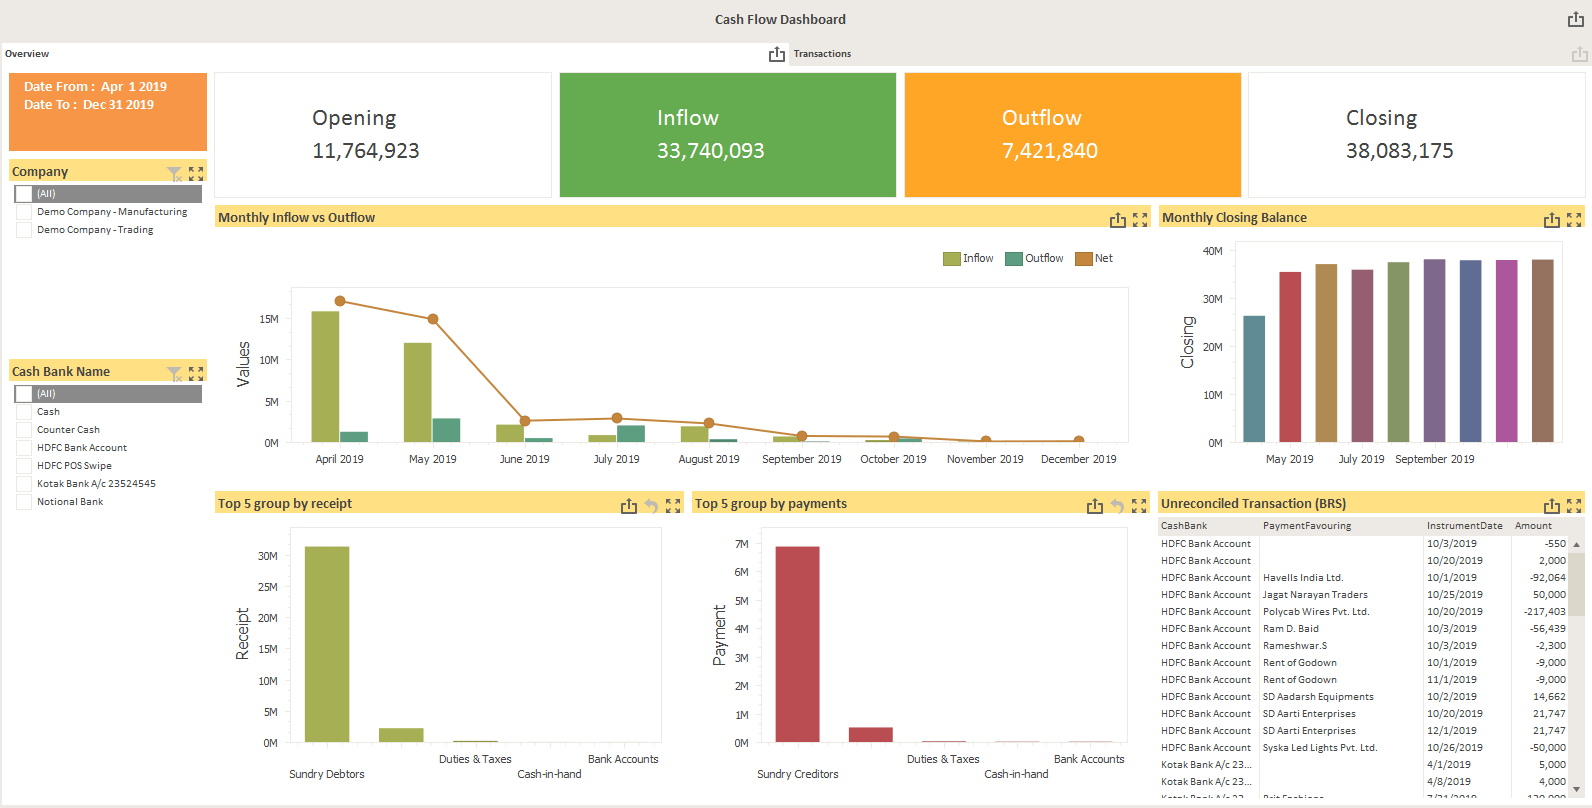
Cash Flow Dashboard

Financial Dashboards

  • Highlight profitability and revenue trends
  • Overall reporting on financial position
  • Debtors, creditors and working capital analysis
  • Project, Profit Centre, Cost Centre wise reporting
  • Cash position, movement and flows
  • Budget and Target vs Actuals
Sales Dashboard

Sales Dashboards

  • Analyse sales trends across time, region, customer group, etc.
  • See top customers and products
  • Filter and interact to see basket size, ticket size
  • Identify inactive customers and products
  • Track salesperson performance
Debtors Dashboard

Debtors Dashboards

  • Get ageing and outstanding by salesperson, region, other dimensions
  • Analyse credit performance against limits
  • View average payment performance
  • Check sales vs receipts and other performance parameters
  • Review receipts and credit notes
Expense Dashboard

Custom Dashboards

  • Build custom dashboards with ERP and non-ERP data
  • Production, project and other dashboards as per need
  • Drag and drop to add widgets and interactivity
  • Full screen or custom width and height
  • Use your own data models or built in data sources