

September 4, 2026
What are the alternatives to Excel for management reporting? Businesses can use BI platforms, dedicated reporting software, and ERP-integrated tools to reduce manual Excel work and improve reporting efficiency.
Excel remains a useful tool for analysis, budgeting and ad-hoc reporting. However, businesses often outgrow manual Excel reporting when management teams have to repeatedly export ERP data, combine spreadsheets, update formulas, prepare MIS reports.
The right choice depends on what you want to automate. BI platforms work well for interactive dashboards and analytics. Dedicated ERP-integrated reporting software can automate recurring financial, MIS and operational reports directly from business data.
The goal is not necessarily to eliminate Excel. The better approach is to reduce repetitive spreadsheet work and automate the reporting process wherever possible.
Why Are Businesses Looking Beyond Excel for Management Reporting?
Common problems include:
- Repeated ERP data exports
- Manual copy-and-paste work
- Complex formulas and spreadsheets
- Multiple versions of the same report
- Difficult consolidation across companies or branches
- Delayed MIS reporting
- Repetitive report distribution
- Large files that become difficult to manage
These challenges can shift the attention from analysing business performance to preparing the information needed for that analysis. That does not mean businesses need to stop using Excel altogether.
Instead, they can use automation to handle repetitive reporting tasks while keeping Excel available for analysis, budgeting, modelling or other situations where it adds value.
What Are the Main Alternatives to Excel for Management Reporting?
Businesses can choose from several approaches depending on their reporting requirements.
1. Business Intelligence and Dashboard Platforms
They connect data sources to reporting models and allow users to create interactive dashboards, KPIs, charts, filters and analytical views.
A BI platform can work well when management wants to:
- Monitor KPIs
- Analyse trends
- Compare actuals with targets
- Filter information by business dimension
- Drill into data
A management team may need more than a dashboard. It may also need a monthly P&L, balance sheet, cash-flow report, sales analysis, outstanding report, detailed transaction register and a management pack.
That is where dedicated reporting software can provide a different approach.
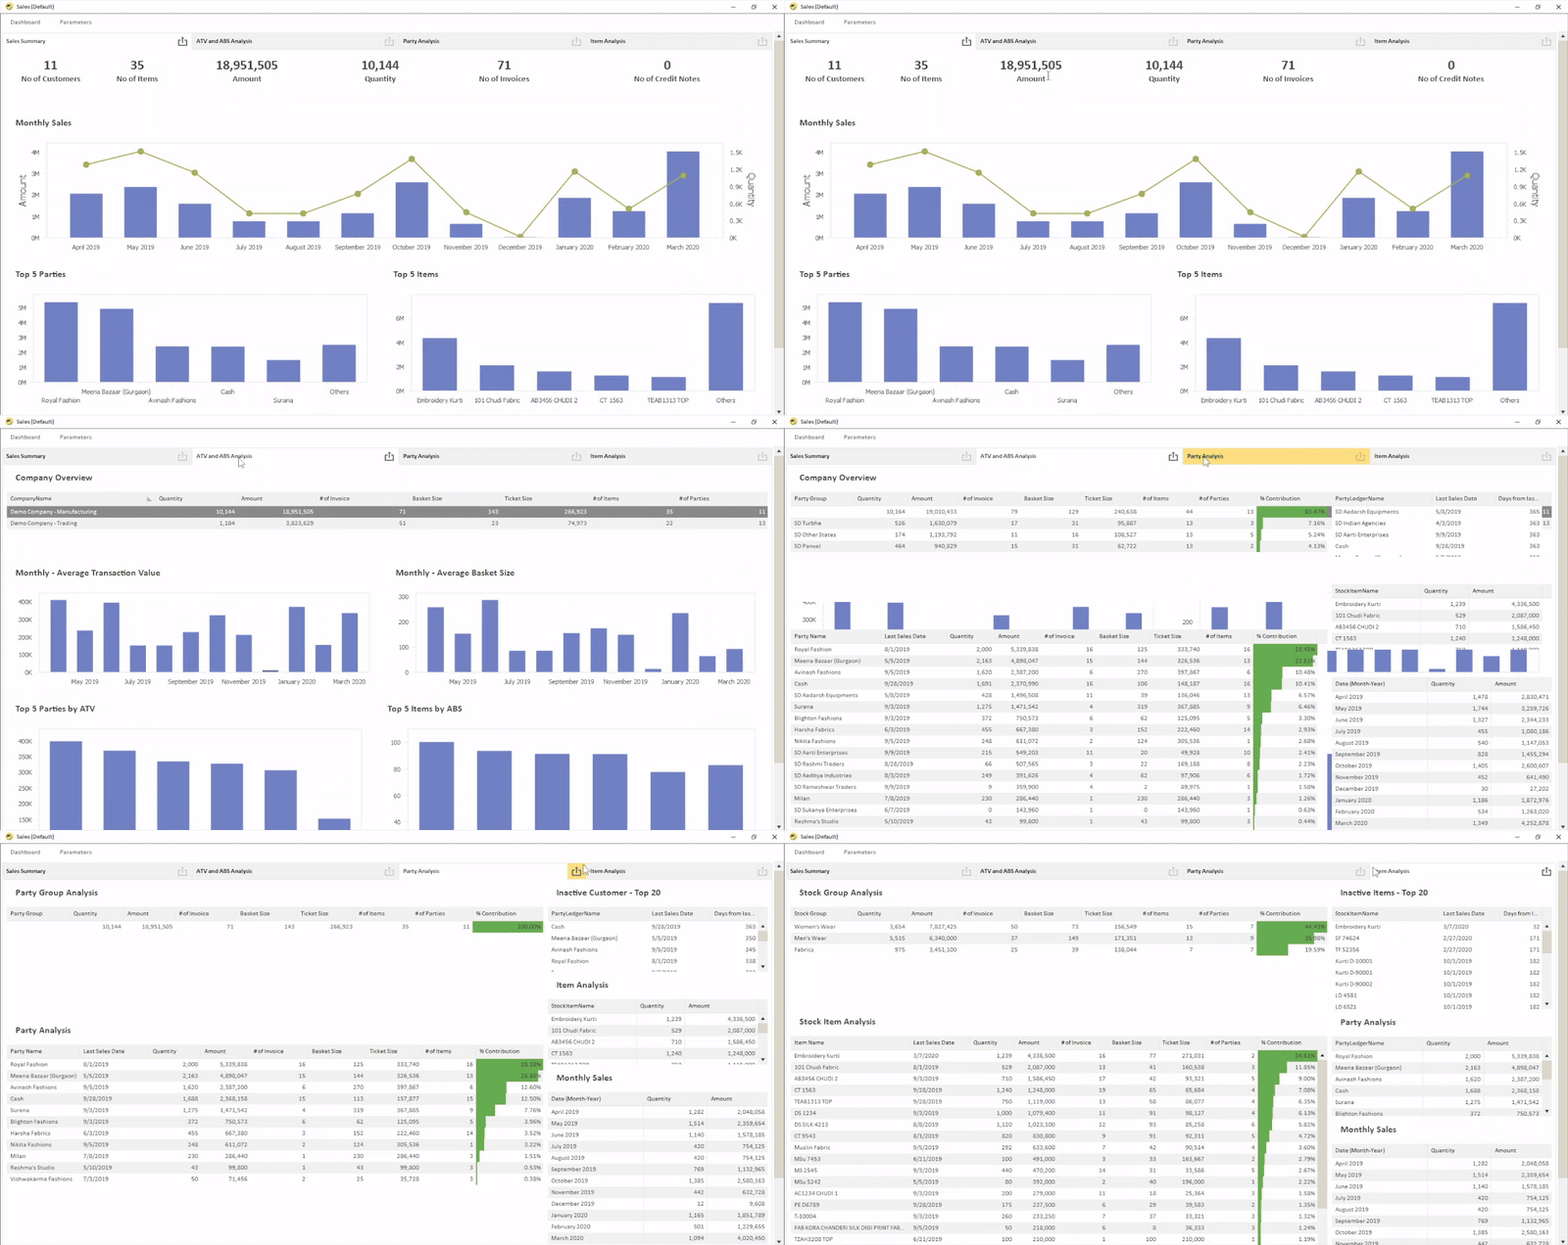
2. Dedicated Management Reporting Software
Instead of recreating the same report every month, teams can configure the report structure and reuse it.
Common management reporting requirements include:
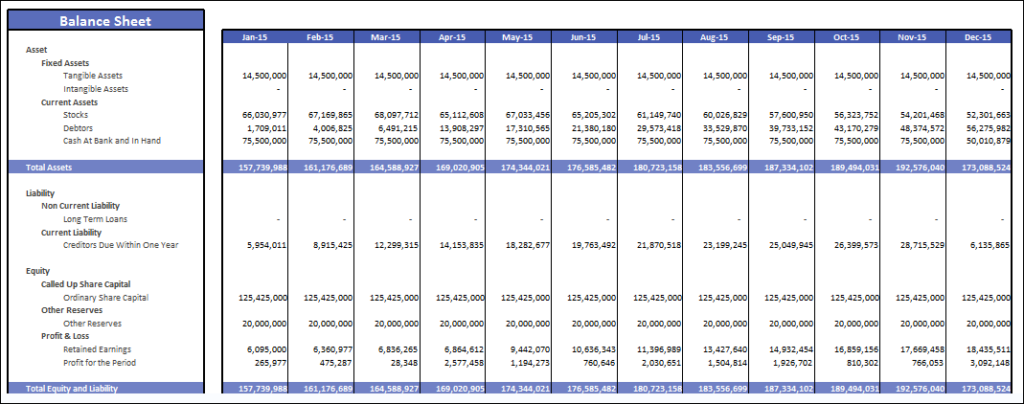
- Balance sheet & Profit and loss reports
- Cash-flow reports
- Budget vs. actual analysis
- Sales & Purchase reports
- Inventory reports
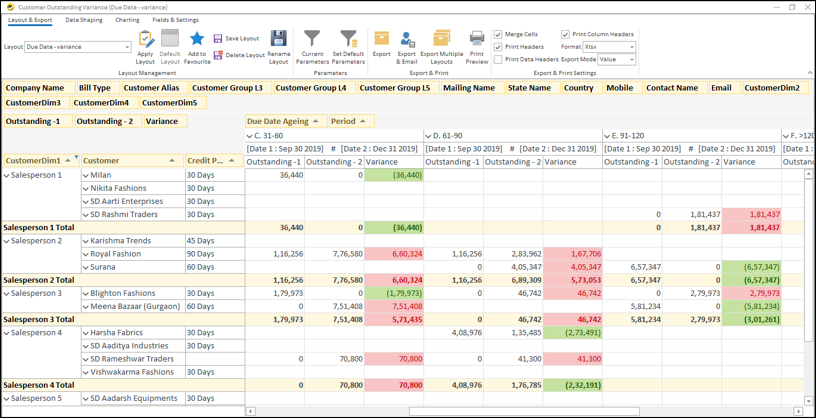
- Customer and receivables reports
- Cost-centre reports
- Management dashboards
This approach suits businesses that want to automate the report creation process itself, rather than only visualize data.
It can also help when management needs both detailed reports and summarized dashboards from the same underlying information.
3. ERP-Integrated Reporting Software
For businesses that generate most of their management information from an ERP, ERP-integrated reporting software can provide a direct alternative to manual Excel reporting.
Instead of:
ERP → Export → Excel → Manual reporting
the workflow can become:
ERP → Reporting software → Reports and dashboards → Scheduled distribution
This removes several repetitive steps from the reporting process.
EasyReports supports connections with multiple ERP and database sources, including Tally, SAP Business One, SAP HANA, Microsoft Dynamics NAV/D365 and databases such as SQL Server, PostgreSQL, MySQL, ODBC-supported databases and Oracle.
This approach can be particularly useful when finance teams repeatedly export ERP data into Excel before preparing management reports.
Tally reporting
For Tally users, EasyReports supports Tally.ERP 9 and Tally Prime integration with automated and manual imports and user-defined scheduling options. It also provides ready reports and dashboards covering areas such as sales, purchase, debtors, creditors, general ledger, cost centre and inventory.
SAP Business One reporting
For SAP Business One and SAP HANA users, EasyReports can connect directly to the database and provide reporting using current data when reports execute. Its reporting scenarios cover areas such as financials, general ledger, sales, purchase, inventory, customers and orders.
This makes ERP-integrated reporting particularly relevant for businesses that already have their transactional information in an ERP but still depend heavily on Excel for management reporting.
4. AI-Assisted Management Reporting
AI-assisted tools can help teams analyse information, identify trends, explain variances or generate summaries. However, AI does not remove the need for reliable source data.
AI can add another layer to this process, but it should not be treated as a substitute for a reliable reporting foundation.
For many businesses, the first priority should remain automating data collection, report preparation and distribution. AI can then support analysis on top of that foundation.
Excel vs. Automated Management Reporting
The biggest difference is not where the final report opens. The difference is how the business creates and maintains the report.
| Reporting requirement | Manual Excel reporting | Automated reporting |
| Data collection | Manual exports | Connected data sources |
| Data consolidation | Manual file combination | Configured process |
| Calculations | Spreadsheet formulas | Centralized reporting logic |
| KPI updates | Manual refresh | Connected/automated |
| Dashboards | Manually updated | Connected dashboards |
| Financial reports | Repeated formatting | Standardized formats |
| Multi-company reporting | Often complex | Consolidated reporting |
| Report distribution | Manual email | Scheduled distribution |
| Report consistency | Depends on users | Standardized layouts |
| Version control | Multiple files possible | Centralized reporting environment |
| Excel usage | Main reporting workspace | Supporting/input tool where needed |
This approach does not make Excel irrelevant.
For example, EasyReports supports Excel and Google Sheets integration for additional information such as budgets, targets and reporting dimensions.
It can also create spreadsheet-style reports within the reporting platform, reducing dependence on manually maintained Excel reporting files.
So the objective is not:
“Never use Excel again.”
It is:
“Stop using manual Excel work for tasks that software can automate.”
How EasyReports Helps Automate Management Reporting
Connect Data From ERP, Databases and Excel
EasyReports focuses on reporting and MIS automation across ERP systems, databases, Excel and other business data sources.
The platform can bring together data connectivity, report creation, dashboards, scheduling and distribution within one reporting environment. Businesses can connect data from ERP systems such as Tally and SAP Business One, databases such as SAP HANA, or Excel files and use that data to create reports, MIS, dashboards and management views.
Build Reports and Dashboards from Excel Data
EasyReports supports spreadsheets, pivots, grids, PDFs and dashboards, along with user-wise filtration, background execution, report scheduling and multi-company consolidated reporting. Excel data can be used as a reporting source, allowing businesses to build dashboards and management reports from existing Excel-based information.
For example, a business using Tally can automate data imports and schedule recurring reports, while a business using SAP Business One or SAP HANA can connect directly to its database for reporting. Businesses that maintain operational or management data in Excel can also use that data to create reports and dashboards in EasyReports.
Explore EasyReports Discover how EasyReports can simplify financial reporting, dashboards, MIS and reporting automation.
Get a Free Demo See how EasyReports can fit your financial consulting and client reporting requirements.
Frequently Asked Questions
1. What is the best alternative to Excel for management reporting?
The best alternative depends on the reporting requirement. BI platforms suit interactive dashboards and analytics, while dedicated or ERP-integrated reporting software can be better suited to recurring financial, MIS and operational reports.
2. Can management reporting be automated without Excel?
Yes. Businesses can connect reporting software directly to ERP systems, databases or other data sources to automate data collection, report generation and distribution. Excel can still be used for budgeting, modelling or ad-hoc analysis.
3. Is Power BI a replacement for Excel reporting?
Power BI can replace many Excel-based dashboard and analysis workflows, but it does not necessarily replace every type of management report. Businesses should compare their needs for dashboards, financial statements, detailed reports and scheduled distribution.
4. What is the difference between BI and management reporting software?
BI platforms generally focus on interactive analysis, dashboards and data visualization. Management reporting software can focus more heavily on recurring financial, operational and MIS reports, standardized formats and automated distribution.
5. Can ERP reporting software automate monthly management reports?
Yes. ERP-integrated reporting software can connect to business data, generate configured reports and schedule them for distribution, reducing repetitive export and spreadsheet preparation work.
6. Can automated reporting software still use Excel data?
Yes. Reporting platforms can use Excel as an additional data source where businesses maintain budgets, targets or other information outside their ERP.
7. Can management reporting software handle multiple companies?
Many reporting platforms support multi-company or consolidated reporting. This can help businesses combine or compare financial and operational information across entities.
8. Do businesses need to stop using Excel completely?
No. Excel remains useful for ad-hoc analysis, budgeting, modelling and other tasks. The objective of reporting automation is to reduce repetitive spreadsheet work rather than eliminate Excel completely.