

August 14, 2025
Project profitability reports help businesses track project revenue, costs, margins and budget performance. With EasyReports, you can generate detailed project profitability reports from ERP data and analyze performance through reports and dashboards.
1. What Are Project Profitability Reports?
Project profitability reports show the revenue, costs, profit margins and budget performance of individual projects. They help businesses identify profitable projects, track cost overruns and take action before margins decline.
2. Why Monitoring Project Profitability Benefits Your Business
Regularly checking project profitability gives you:
- Better financial control – You know where money is going and why
- Improved cost efficiency – Reduce waste and unnecessary expenses
- Higher success rate – Focus on projects that give maximum returns
3. Use Project Profitability Reports to Track Performance
A reporting tool like EasyReports automates this process. With EasyReports, you can:
- Pull data directly from Tally or other ERP & data sources
- Generate detailed profit and cost reports in seconds
- Compare budgets with actual performance
- Perform cost allocations of common or corporate costs across projects
- Assign salary costs across projects based on timesheets and allocation ratios
4. Key Project Profitability Reports in EasyReports
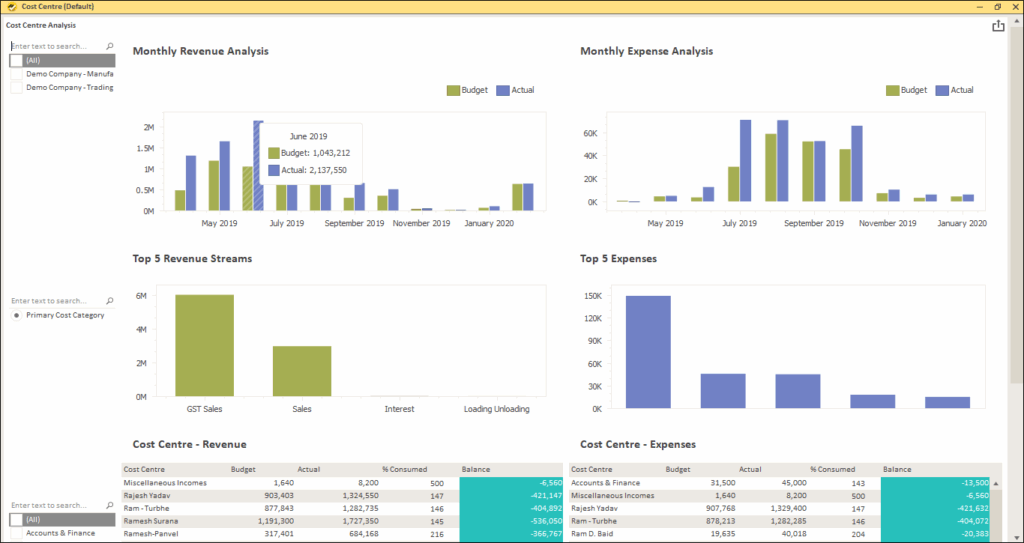
I) Monitor Key Metrics in the Cost Centre Dashboard
This Dashboard gives you a complete visual snapshot of project performance. The breakdown given below:
- Monthly Revenue and Expense Analysis – Compare budgeted vs actual figures month by month using clear bar charts.
- Top 5 Revenue Streams – Identify which income sources, like GST Sales or other categories, bring the most revenue.
- Top 5 Expenses – Spot the largest cost drivers instantly, helping you take action on overspending areas.
- Cost Centre-wise Revenue and Expenses – Check the budget, actuals, % consumed and balance for each cost centre at a glance.
This dashboard is perfect for managers who want quick, data-driven insights without digging into multiple reports.
II) Profit & Loss – Cost Centre Report
This report gives you a month-by-month view of revenue, expenses and profit for each project or cost centre. It helps:
- Side-by-side monthly figures to compare performance over time.
- Amount Percent Variation to quickly spot increases or decreases in income and expenses.
- Helping you see which areas contribute most to profit or loss.
With this report, you can easily identify trends, monitor variances, and take action to improve profitability before small issues become big problems.
III) Track Every Transaction with Cost Centre Transactions
This report gives a complete summary of all financial entries linked to a specific project or cost centre. It helps:
- Voucher-level details such as date, narration, voucher type and reference for each transaction.
- A clear split of accounts like GST Sales or Discount Given, so you know exactly where money is coming from or going to.
- Helping you track individual contributions and expenses.
By regularly reviewing this report, you can ensure every transaction is correctly recorded, spot any wrongly assigned entries and maintain accurate project accounts.
IV) Track Cost Allocations
Cost allocations can be done based on defined rules as needed by the organization:
- Cost Allocation Report – Track cost allocations from a common pool to projects
- Salary Cost Allocations Report – Track salary cost allocation across projects
V) Compare Budgets with Budget vs Actual – Ledger CC
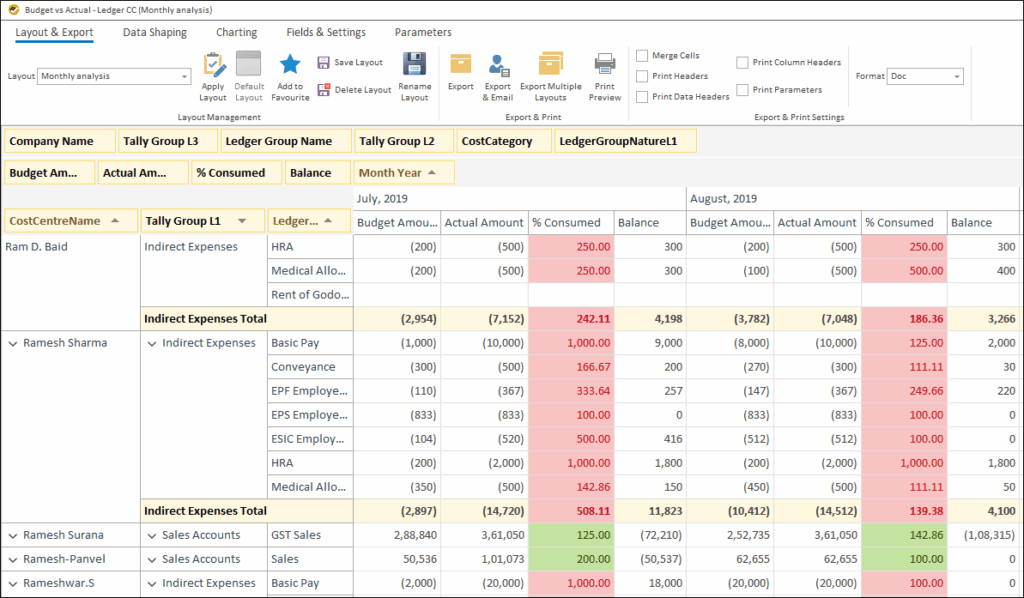
This report helps to see if your project is staying within its planned budget. It tells:
- Budget Amount vs Actual Amount for each ledger, cost centre or team member.
- % Consumed highlighted in colour — green for on-track spending and red for overspending, so you can spot issues instantly.
- Balance figures showing how much budget is left or exceeded.
- A detailed breakdown for both income (like GST Sales) and expenses (like salaries, allowances, and operational costs).
By checking this report regularly, you can quickly identify cost overruns, adjust spending plans, and keep your projects profitable before small variances turn into major losses.
VI) Review Costs with Expense Analysis
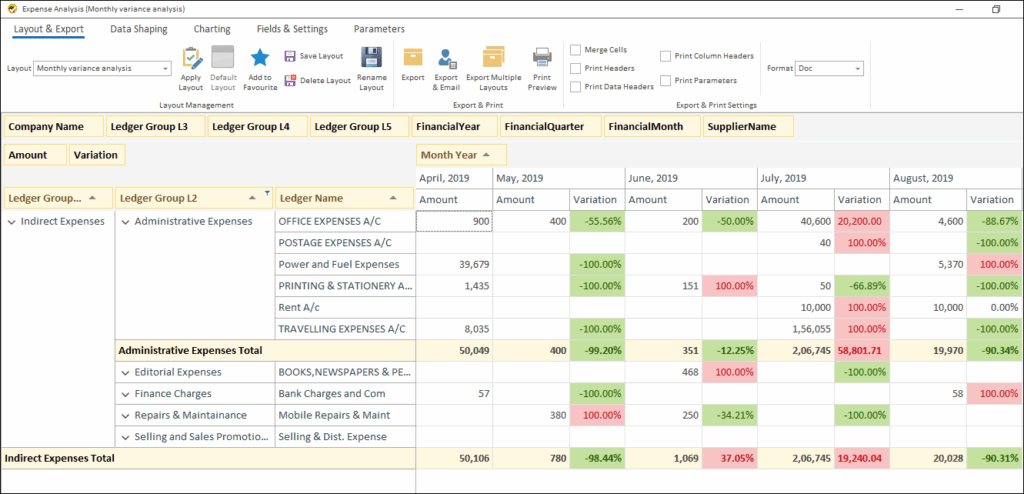
This report gives a clear breakdown of your spending across different expense categories. It
- Detailed Expense Groups
Expense groups like: Staff salaries & benefits, utilities, professional services, warehousing & logistics, office supplies & miscellaneous expenses, internet costs, etc.
These help track all major cost areas in one place and spot unusual spending patterns.
- Monthly amounts with percentage variations to instantly spot increases or decreases in spending.
By monitoring this report regularly, you can quickly identify overspending trends, control indirect costs, and protect your project’s bottom line.
5. How to Get Start with EasyReports?
To track project profitability using reporting tool like EasyReports, follow the process below:
- Install EasyReports: Set up the reporting tool
- Integrate with multiple data sources: Integrate with ERPs, databases and other data sources
- Run initial reports: Generate standard reports to understand your stock position
- Set up regular schedules: Create automatic report generation schedules
Monitoring project profitability is not just about tracking numbers, it’s about making smarter decisions. With EasyReports, you get detailed reports and dashboards that make it simple to see where your projects are making money and where they are losing it.
By regularly using reports like Profit & Loss – Cost Centre, Cost Centre Transactions, and Budget vs Actual Ledger CC, you can stay in control and ensure every project delivers maximum profit. Get the demo now!
Frequently Asked Questions (FAQs)
1. What are project profitability reports?
Project profitability reports show project revenue, costs, margins and budget performance to help businesses control profitability.
2. What does a project profitability report show?
A project profitability report shows revenue, expenses, profit, budgets, actual costs and variances for each project.
3. How can I create project profitability reports?
EasyReports connects with ERP and other data sources to generate project profitability reports, dashboards and analysis.
4. Which reports help track project profitability?
Key reports include Cost Centre Dashboard, Profit & Loss, Cost Centre Transactions, Budget vs Actual and Expense Analysis.
5. Can project profitability reports compare budgets with actuals?
Yes. EasyReports compares project budgets with actual costs and highlights variances that may affect profitability.