

July 22, 2026
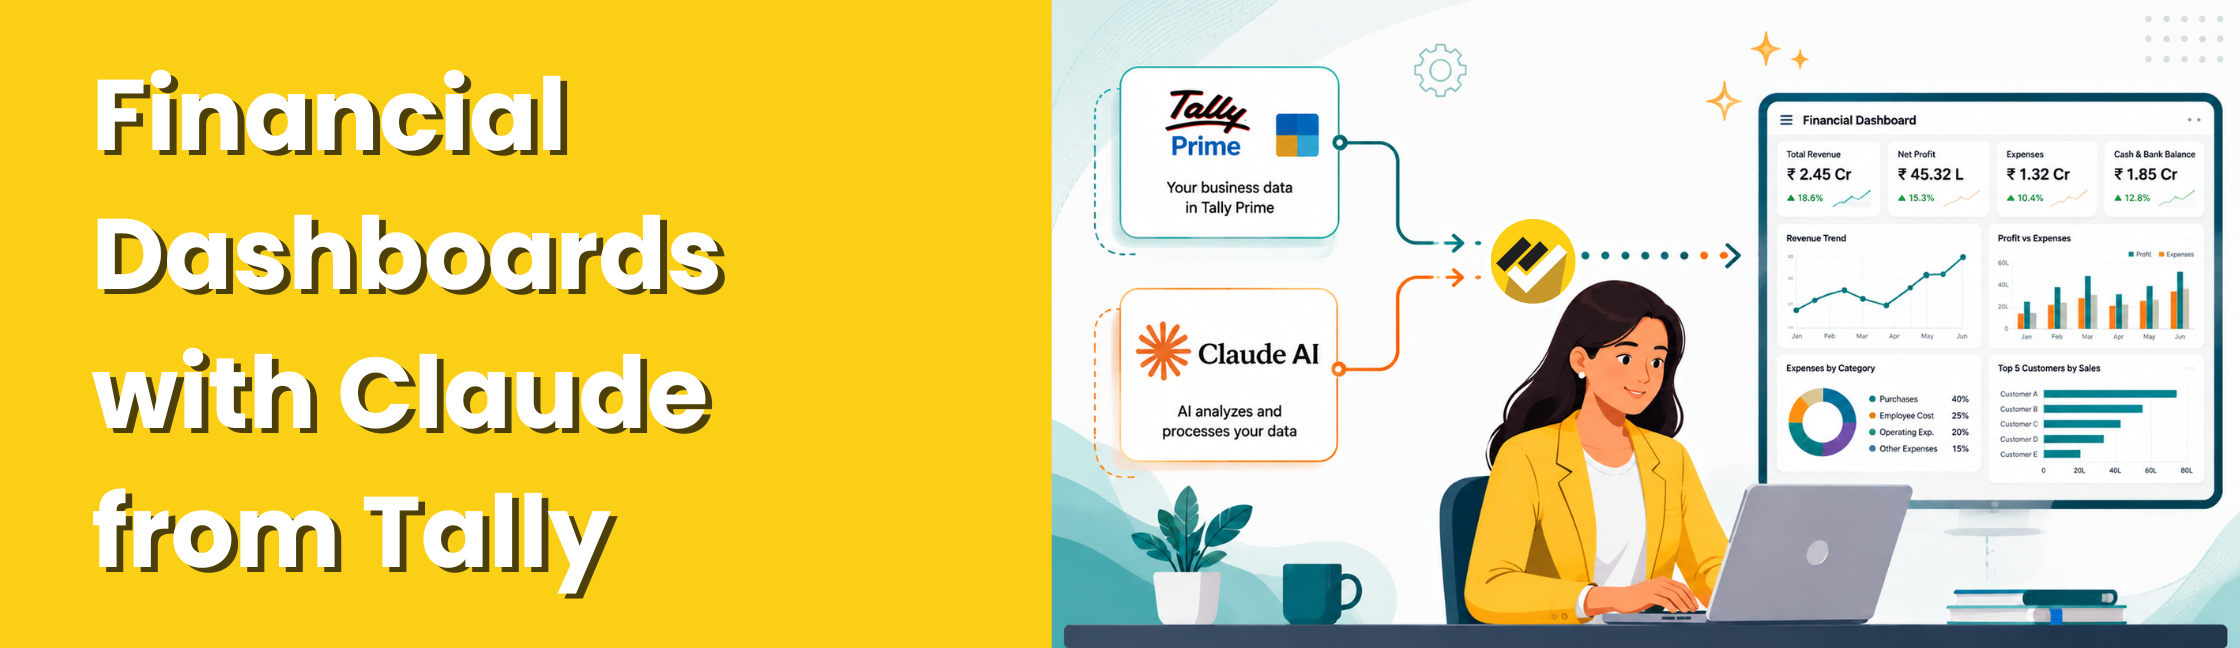
Generating financial dashboards with Claude AI from Tally Prime involves connecting Tally Prime data to a structured SQL database using the EasyReports Tally Connector. Claude AI then accesses the data through a configured connector, allowing users to generate dashboards, analyse financial performance, and answer business questions using natural language prompts.
What Does Generating Financial Dashboards with Claude AI Mean?
Generating financial dashboards with Claude AI means using artificial intelligence to automatically analyze structured financial data. Instead of creating multiple reports separately, a single prompt can generate a complete management dashboard containing financial KPIs, charts, tables, and executive summaries. A typical AI financial dashboard may include:
- Financial Statements (Balance Sheet Profit & Loss Statement etc)
- Financial Analysis (Budget vs Actual Analysis Financial Ratio Analysis Expense Analysis etc)
- Working Capital & Cash Flow (Accounts Receivable Accounts Payable Working Capital)
Because Claude AI analyses multiple datasets together, it can also explain why financial performance has changed rather than simply displaying numbers.
What Financial Data Can Claude AI Use from Tally Prime?
Claude AI can analyse a wide range of business information once Tally Prime data is organized through the EasyReports Tally Connector and stored in SQL Server.
Depending on your business configuration, Claude AI can work with:
- Financial Data (Profit & Loss, Balance Sheet, Cash Flow)
- Customer Data (Outstanding, Receivables, Customer Ageing)
- Supplier Data (Outstanding, Payables, Vendor Ageing)
- Inventory Data (Stock Value, Slow Moving Inventory)
- Sales Analytics (Monthly Revenue, Product Performance)
How Does the Architecture for Generating Financial Dashboards with Claude AI Work?
The integration follows a secure architecture designed for enterprise reporting.
Tally Prime ➤ EasyReports Tally Connector / SQL Database ➤ Claude AI ➤ Financial Dashboard
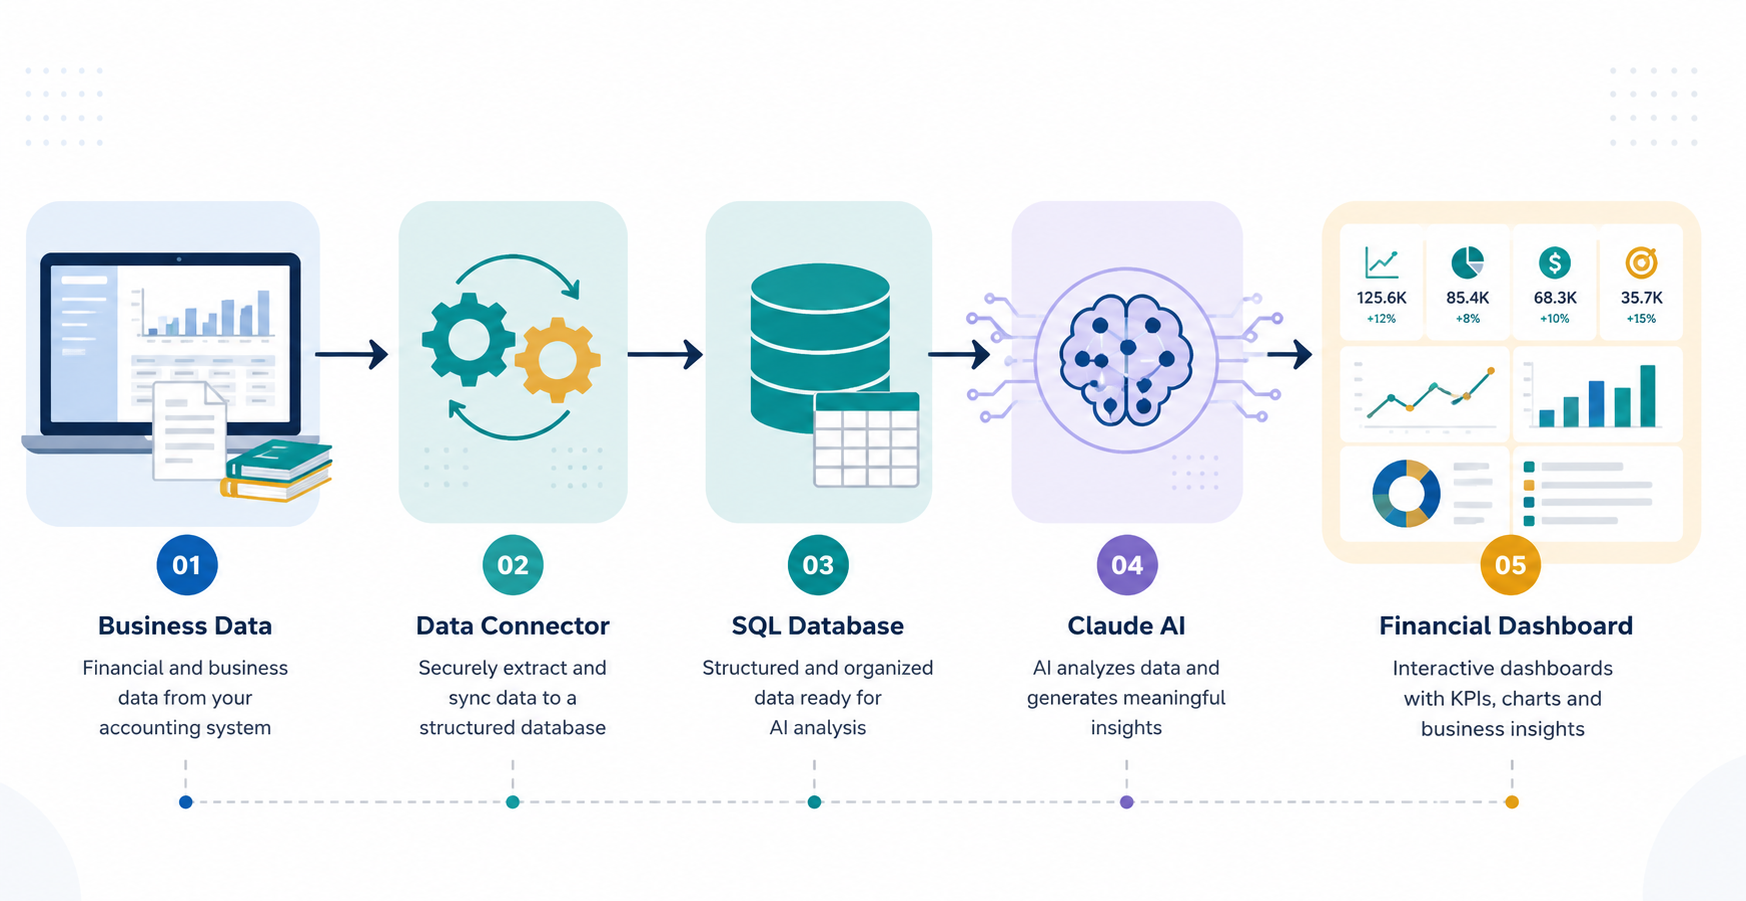
Each component has a specific role:
- Tally Prime stores your accounting and business transactions.
- EasyReports Tally Connector extracts and synchronizes the required data.
- SQL Server organizes the information into a structured reporting database.
- Claude AI interprets your prompt, retrieves the relevant information, performs calculations, and generates an easy-to-understand financial dashboard.
This architecture keeps your accounting records intact while enabling secure AI-powered reporting.
How Does Claude AI Generate Financial Dashboards from Tally Prime?
Generating a financial dashboard with Claude AI involves more than simply connecting AI to Tally Prime. The process requires structured business data so Claude AI can accurately retrieve information, calculate KPIs, compare financial periods, and generate meaningful business insights.
EasyReports simplifies this process by preparing Tally Prime data for AI-powered analysis without modifying any accounting records.
Step 1: Connect Tally Prime with EasyReports Tally Connector
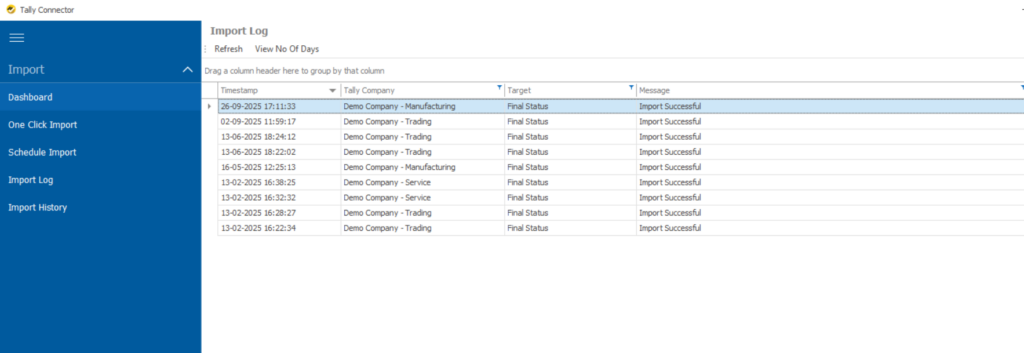
The first step is connecting Tally Prime with the EasyReports Tally Connector.
The connector automatically extracts business data from Tally Prime and synchronizes it with a structured SQL database.
Typical data includes:
- Masters
- Accounting Records
- Inventory Records
- Financial Statement Mapping
Unlike manual exports, the synchronization process keeps your reporting database updated automatically, reducing repetitive work for finance teams.
Step 2: Store Tally Data in SQL Server
Once EasyReports extracts the information, it stores the data in a structured SQL Server database.
Instead of reading thousands of accounting vouchers directly, Claude AI can access well-organized business tables designed specifically for reporting and analytics.
Step 3: Connect SQL Server to Claude AI Using a Connector
The connector acts as a secure communication layer between Claude AI and your SQL database.
Instead of giving Claude AI unrestricted database access, the connector securely retrieves only the information required to answer a user’s request.
For example, if a finance manager asks:
“Show my monthly profit dashboard.”
Claude AI sends the request to the connector.
The connector retrieves the relevant financial data from SQL Server.
Claude AI then analyses the results and generates a visual financial dashboard with KPIs, charts, and an executive summary.
This architecture helps organizations maintain data security while enabling AI-powered reporting.
Step 4: Ask Claude AI to Generate a Financial Dashboard
Once the connection is complete, users can generate dashboards simply by describing what they need.
Instead of searching through multiple reports, they can ask Claude AI using natural language.
For example:
- Generate my monthly financial dashboard.
- Compare this month’s sales with last month.
- Show my cash flow dashboard.
Claude AI retrieves the required information and presents it in an easy-to-understand format.
Note: EasyReports can customize Claude AI skills to match your organization’s financial reporting requirements and industry-specific KPIs.
The following prompts are sample examples.
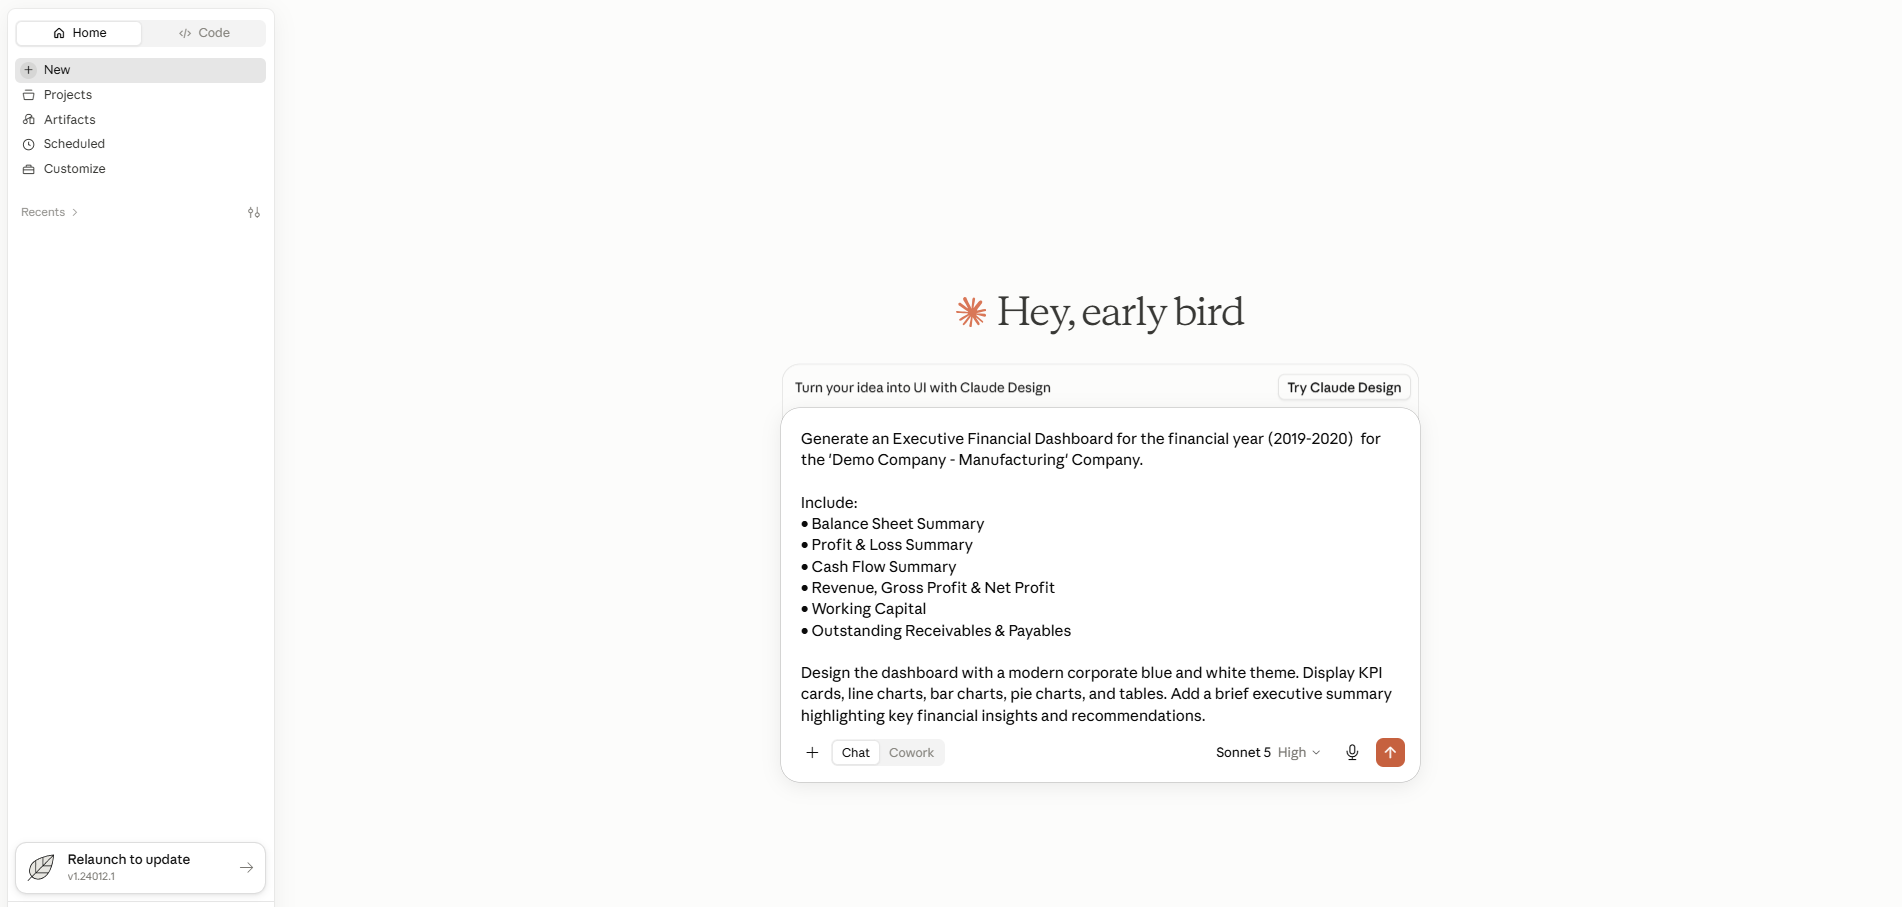
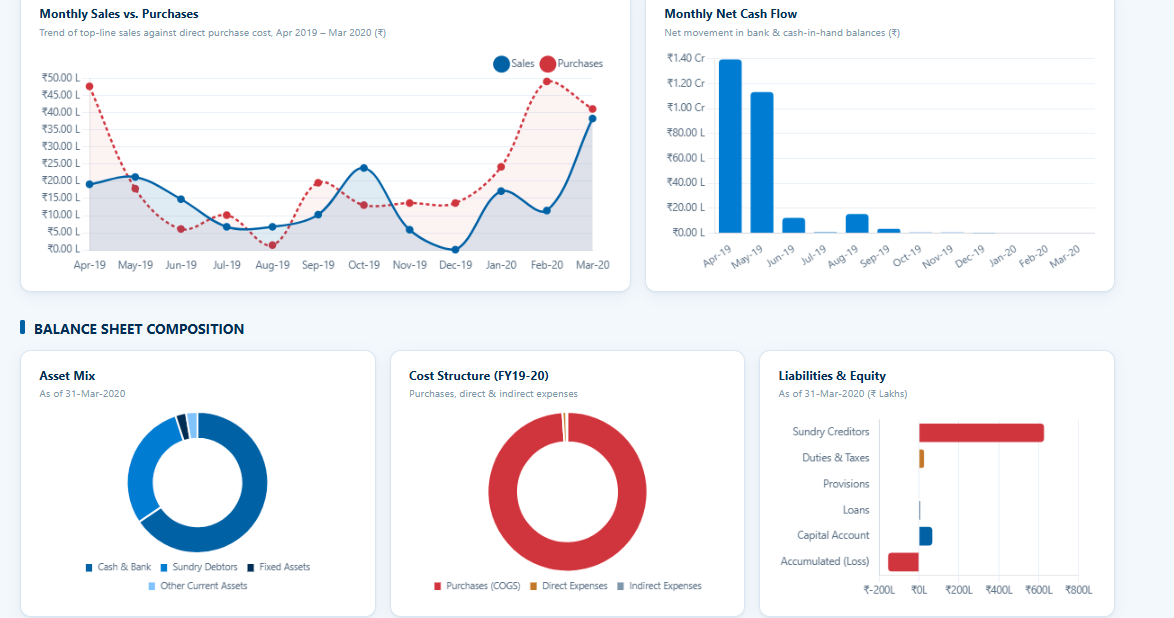
Example Prompt 1: Executive Financial Dashboard
Generate an Executive Financial Dashboard of the financial year (2019-2020) for the “Demo Company- Manufacturing”.
Include:
- Balance Sheet Summary
- Profit & Loss Summary
- Cash Flow Summary
- Revenue, Gross Profit & Net Profit
- Working Capital
- Outstanding Receivables & Payables
Design the dashboard with a modern corporate blue and white theme. Display KPI cards, line charts, bar charts, pie charts, and tables. Add a brief executive summary highlighting key financial insights and recommendations.
Why Use EasyReports Tally Connector Before Connecting AI?
EasyReports Tally Connector extracts data from Tally Prime and stores it in a structured SQL database. The connector then allows Claude AI to safely access that data and answer business questions.
Most importantly, no one needs to modify or overwrite any data inside Tally Prime. Your accounting data remains secure and unchanged.
Want to see how EasyReports Tally Connector helps you on this? Book a free EasyReports demo today.
Disclaimer: Claude is a product of Anthropic. Tally Prime is a product of Tally Solutions Pvt. Ltd. EasyReports is an independent reporting and business intelligence solution and is not affiliated with, endorsed by, or sponsored by Anthropic or Tally Solutions Pvt. Ltd. The information provided in this article is for educational and informational purposes only.
Frequently Asked Questions (FAQs)
1. How do I generate financial dashboards with Claude AI from Tally Prime?
To generate financial dashboards with Claude AI, first synchronize your Tally Prime data to a structured SQL Server database using the EasyReports Tally Connector. Claude AI can then analyze the data and generate dashboards based on natural language prompts.
2. Can Claude AI connect directly to Tally Prime?
Claude AI cannot connect directly to Tally Prime. Your Tally Prime data must first be extracted and stored in a structured database before Claude AI can securely access it.
3. What does generating financial dashboards with Claude AI mean?
It means using Claude AI to analyze structured financial data and automatically create dashboards, charts, KPIs, and business insights. This reduces manual reporting and speeds up financial analysis.
4. What financial dashboards can Claude AI generate from Tally Prime?
Claude AI can generate dashboards for Profit & Loss, Balance Sheet, Cash Flow, Working Capital, Sales Performance, Budget vs. Actual, Receivables, Payables, Inventory, and Financial Ratios.
5. Why is SQL Server required before connecting Claude AI?
SQL Server organizes Tally Prime data into a structured format for reporting. This enables Claude AI to retrieve accurate information and generate meaningful financial dashboards efficiently.
6. What data can Claude AI analyze from Tally Prime?
Claude AI can analyze financial statements, sales transactions, customer receivables, supplier payables, inventory data, cash flow, working capital, and other financial KPIs stored in the reporting database.
7. Can I generate financial dashboards with Claude AI using natural language prompts?
Yes. You can simply ask prompts like “Generate my monthly financial dashboard” or “Show this month’s cash flow,” and Claude AI will generate the requested dashboard based on your data.
8. Why should I use the EasyReports Tally Connector with Claude AI?
The EasyReports Tally Connector automatically synchronizes Tally Prime data into SQL Server, providing Claude AI with structured data for accurate reporting. It also keeps your original Tally Prime data unchanged.
9. Is coding required to generate financial dashboards with Claude AI?
No. Once the integration is configured, you can generate dashboards using simple natural language prompts without writing SQL queries or programming code.
10. Can small and medium-sized businesses benefit from Claude AI financial dashboards?
Yes. Businesses using Tally Prime can automate financial reporting, gain real-time insights, and make faster business decisions using Claude AI and the EasyReports Tally Connector.