
June 4, 2026
How are companies generating ERP insights in 2026? By using Business Intelligence (BI) tools, real-time dashboards, and automated reporting solutions. These tools transform ERP data from systems like Tally, SAP, Oracle, and Microsoft Dynamics into actionable insights by analyzing sales, inventory, profitability, customer performance, cash flow, and operational KPIs. Modern businesses increasingly rely on automated dashboards and analytics platforms to make faster, data-driven decisions and improve business performance.
Businesses collect more ERP data than ever before. Every sales order, purchase transaction, inventory movement, production activity, and financial entry creates valuable information. The challenge is not collecting data anymore. The real challenge is turning ERP data into insights that help businesses make better decisions.
Many companies still have access to huge amounts of ERP data, but they struggle to answer simple questions:
- Why are profits declining?
- Which products generate the highest margins?
- Which customers contribute the most revenue?
- Why is inventory increasing?
- Which branch performs best?
So, how are businesses generating insights from ERP systems in 2026? Let’s explore the most common approaches.
How Companies Generating ERP Insights Using Excel?
Many organizations still use Excel as their primary reporting tool. The process usually looks like this:
ERP System -> Export Data -> Excel Sheets -> Pivot Tables -> Insights
Excel offers flexibility and low initial cost. Users can create custom reports and perform calculations easily. However, businesses often face challenges such as:
- Manual work
- Data duplication
- Formula errors
- Version control issues
- Delayed reporting
As data volumes grow, Excel becomes harder to manage effectively.
Why Do Businesses Use Native ERP Reports?
Most ERP systems provide built-in reporting capabilities. Examples include: SAP Reports, Oracle Analytics, Microsoft Dynamics Reports, Tally Reports etc.
These reports allow users to view operational and financial information directly from the ERP system. The advantages include:
- Direct access to ERP data
- No additional software required
- Standard business reports
However, businesses often encounter limitations:
- Limited customization
- Complex report creation
- Difficult cross-functional analysis
- Challenges combining data from multiple sources
As reporting requirements become more advanced, companies often look beyond native ERP reports.
How Do Business Intelligence Tools Are Generating ERP Insights in 2026?
One of the fastest-growing approaches in 2026 is using Business Intelligence and reporting tools.
Examples include:
- EasyReports
- Power BI
- Tableau
- Qlik
- Looker
The process looks like this: ERP System -> Reporting Tool -> Dashboards & Analytics -> Business Insights
These tools help businesses transform ERP data into interactive dashboards, visual reports, and management analytics. Organizations can monitor: Revenue, Profitability, Inventory, Receivables, Expenses, Operational KPIs etc. from a single platform.

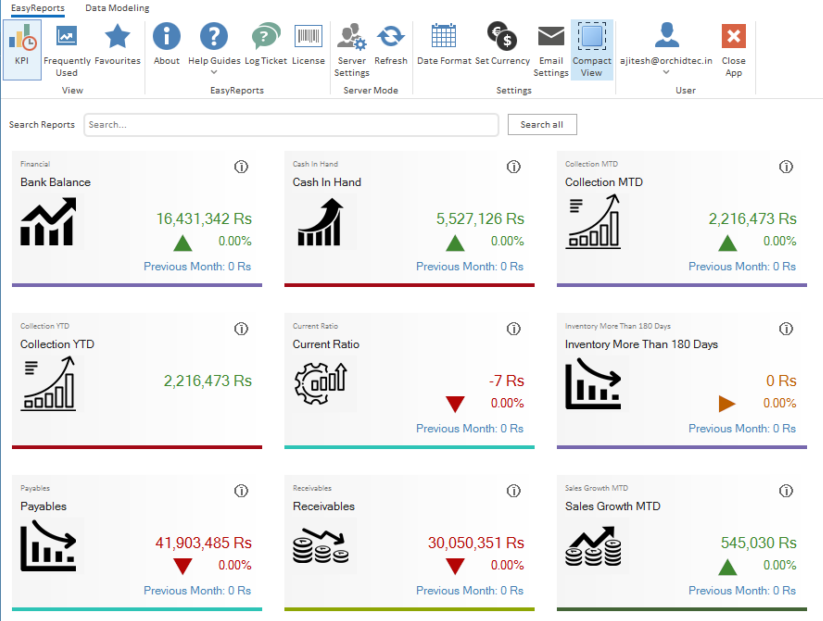
Why Are Real-Time KPI Dashboards Becoming Essential?
Traditional reporting often relies on monthly or weekly reports. Modern businesses want answers immediately. Instead of waiting for reports, management teams can monitor live dashboards showing:
- Revenue performance
- Gross profit
- Outstanding receivables
- Inventory levels
- Cash flow
- Sales targets
Real-time dashboards help decision-makers react quickly when business conditions change. This is becoming a standard requirement across industries in 2026.
How Do Companies Generating Insights Across Departments?
Many organizations still analyze departments separately. Like:
- Finance reviews financial reports.
- Sales reviews sales reports.
- Inventory teams review stock reports.
However, valuable insights often emerge when businesses connect data across departments.
For example:
- Sales growth may increase inventory demand.
- Delayed collections may affect cash flow.
- Supplier delays may impact production schedules.
How Can Reporting Tool Like EasyReports Help Generate Insights from ERP Systems?
EasyReports helps businesses unlock the value of ERP data through automated reporting and analytics. Organizations can use EasyReports to:
- Create management reports & dashboards
- Automate financial statements
- Monitor key business KPIs
- Analyze sales performance
- Track inventory trends
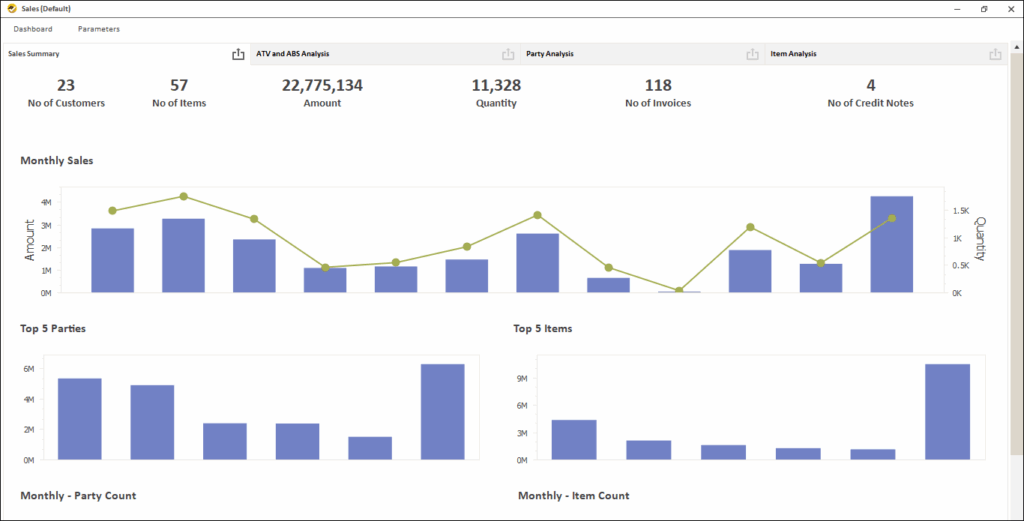
Example: Turning ERP Data into Actionable Sales Insights with EasyReports
Suppose a Sales Manager wants to understand why overall sales growth has slowed during the last quarter.
Using EasyReports, the manager can view a Sales Dashboard that combines ERP data into a single screen. Instead of reviewing multiple reports, they can instantly analyze:
- Management dashboard for top level view
- Sales trends
- Top selling items
- Bottom selling items
- Analyse by salesperson, customer, item, month, quarter, year etc.
The dashboard reveals that sales have declined in one region while two major customers have reduced their purchase volume. This insight helps management take corrective action quickly by focusing on customer retention and regional sales performance.
Case Study: How Sagar Business Generated Better ERP Insights
Sagar Business Pvt. Ltd., a leading distributor in Odisha, struggled to track brand-wise sales performance, inventory levels, outstanding payments, freight costs, and customer profitability across multiple business divisions.
Using EasyReports, the company automated sales, stock, outstanding and freight reporting directly from ERP data. Management gained visibility into:
- Brand-wise and division-wise performance
- Customer-wise sales and outstanding analysis
- Freight cost tracking and profitability
- Sales trends and lost customer analysis
- Cross-selling opportunities across customer segments
Start Generating Smarter ERP Insights with EasyReports in 2026
ERP systems generate valuable business data every day, but with automated dashboards, financial reports and real-time analytics, businesses can identify opportunities faster, improve operational efficiency.
Explore EasyReports and discover how automated reporting can help you gain deeper insights into your business performance. Get your Demo now!
FAQs
Q1. How are companies generating ERP insights in 2026?
Companies are generating ERP insights in 2026 using Business Intelligence (BI) tools, real-time dashboards, automated reporting solutions, and ERP analytics platforms that transform raw ERP data into actionable business information.
Q2. What tools are commonly used to generate ERP insights?
Businesses commonly use tools such as EasyReports, Power BI, Tableau, Qlik, Looker, and native ERP reporting systems to generate insights from ERP data.
Q3. Can Excel be used to generate ERP insights?
Yes, Excel can be used to generate ERP insights through data exports, pivot tables, and custom reports. However, manual processes, data duplication, and scalability challenges often limit its effectiveness as data volumes grow.
Q4. What are the limitations of native ERP reports?
Native ERP reports often provide standard business reports but may have limitations such as restricted customization, complex report creation, and difficulty combining data from multiple sources.
Q5. What are real-time ERP dashboards?
Real-time ERP dashboards provide live visibility into key business metrics such as revenue, profitability, inventory levels, receivables, cash flow, and sales performance, enabling faster decision-making.
Q6. How do Business Intelligence tools improve ERP reporting?
Business Intelligence tools improve ERP reporting by automating data analysis, creating interactive dashboards, consolidating information from multiple sources, and delivering actionable insights in real time.
Q7. How can EasyReports help generate ERP insights?
EasyReports helps businesses generate ERP insights through automated reporting, management dashboards, KPI monitoring, financial statement automation, sales analysis, inventory tracking, and business performance analytics.
Q8. What business areas can be analyzed using ERP insights?
ERP insights can be used to analyze sales performance, customer profitability, inventory management, financial performance, branch operations, receivables, expenses, freight costs, and overall business profitability.