


September 24, 2026
What Is Tally Business Intelligence?
Tally Business Intelligence means using Tally data with BI, reporting and analytics tools to understand business performance and support management decisions.
Tally stores the underlying business transactions. A BI or reporting layer can organize that information into:
- Management reports
- MIS reports
- Dashboards
- KPI reports
- Trend analysis
- Financial analysis
- Sales analysis
- Inventory analysis
- Receivables and payables analysis
- Budget-versus-actual reports
For example, a sales register tells you what transactions occurred. A Tally BI dashboard can help management compare sales by customer, product, salesperson, region, or period.
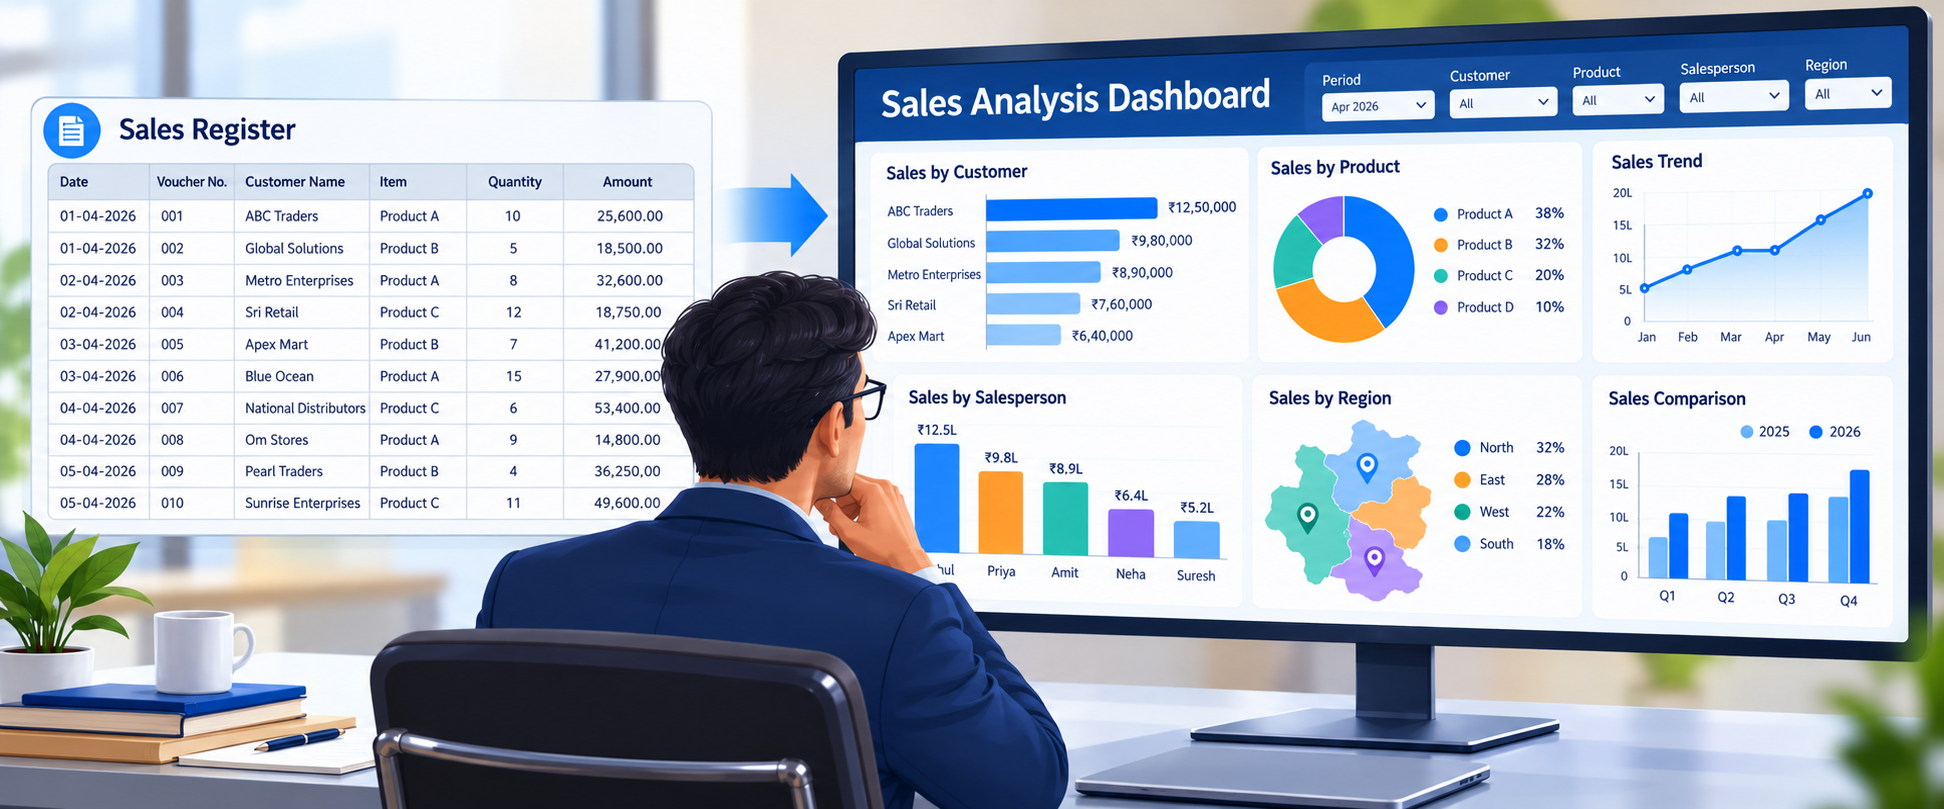
The difference lies in how businesses use the data.
Instead of looking at individual transactions one report at a time, management can bring related information together and analyze it from different perspectives.
Why Is Tally Data Useful for Business Intelligence?
Tally already contains many of the transactions that businesses need to understand their operations. Third party applications can extract Tally data through ODBC or HTTP/XML for external dashboards, business intelligence tools, and reporting systems.
That means businesses do not necessarily need to move away from their existing Tally environment to build a broader reporting and analytics process. Instead, they can use Tally as an important source of business data and add a reporting or BI layer around it.
How Does Tally Business Intelligence Work?
A typical Tally BI workflow looks like this:
Each stage has a specific purpose.
1. Tally records business transactions
Employees enter sales, purchases, receipts, payments, stock transactions, and other business information into Tally.
2. The BI or reporting system connects to Tally
A connector or integration method retrieves the required information from Tally. TallyPrime supports integration through methods including ODBC and HTTP/XML.
3. The system organizes the data
The reporting system structures the information so users can analyze it according to their requirements.
Businesses may also need additional dimensions such as salesperson, region, product category, brand, customer segment, or cost centre.
4. Reports and dashboards present the information
The system can present the data through:
- Tables
- Charts
- Dashboards
- MIS reports
- Financial statements
- KPI reports
- Analytical reports
5. Managers analyse the results
Management can compare current performance with previous periods, targets, budgets, or other business dimensions.
6. The business takes action
The final objective is not simply to create another report.
- The objective is to help managers answer questions such as:
- Which customers have overdue payments?
- Which region generates the highest sales?
- Which projects generate better margins?
- Are actual results meeting the budget?
What Is the Difference Between Tally Reports and Tally Business Intelligence?
| Sl. No. | Reports in Tally Prime | Business Intelligence for Tally Data |
|---|---|---|
| 1 | Provide individual accounting or operational reports | Combines reporting and analytical views |
| 2 | Focus heavily on transactions and accounting information | Focuses on analysis and management information |
| 3 | Users often open specific reports | Users can use dashboards and analytical reports |
| 4 | Useful for operational monitoring | Useful for management-level analysis |
| 5 | Can answer what happened | Can help compare, investigate, and understand patterns |
| 6 | Focused on accessing and working with business reports | Report, dashboard, KPI and analysis-focused |
This does not mean that Tally cannot provide useful analysis. Tally Prime already offers extensive reporting and integration capabilities.
The difference comes from adding an analytical layer that helps businesses organize, visualize, compare, and distribute information according to management requirements.
What Should You Look for in a Tally BI Tool?
Choosing a Tally Business Intelligence solution involves more than checking whether it can display charts.
Consider these capabilities.
I) Tally Integration
The solution should connect with the Tally environment and retrieve the data required for reporting.
II) Automated Data Synchronization
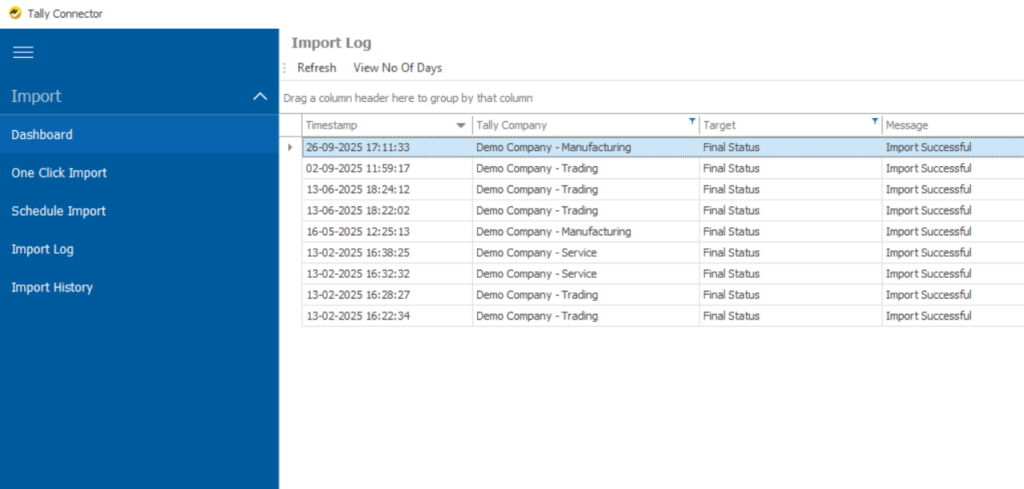
Look for automated import or synchronization options so teams do not need to repeatedly export and prepare files manually.
III) Custom Reports, Dashboards, MIS Reporting
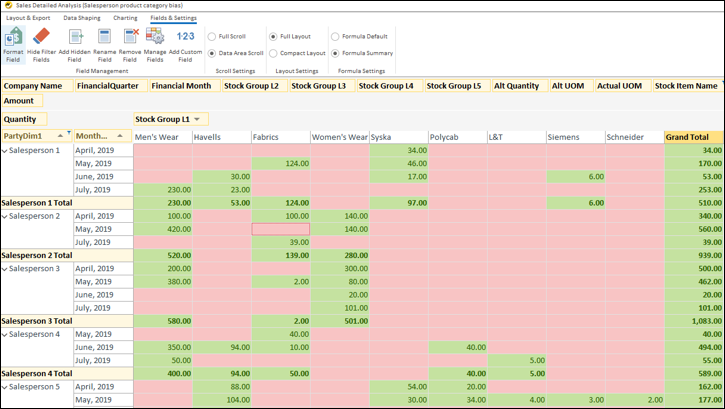
Every business has different reporting requirements. The solution should allow users to create or customize reports according to their business processes.
Dashboards should bring important metrics together and make them easier to review.

IV) Custom Fields and UDFs
Businesses often use additional fields in Tally. The reporting system should support relevant custom data where required.
V) Excel Integration
Businesses may maintain budgets, targets, or additional dimensions outside Tally. Combining those inputs with Tally data can provide a more complete management view.
VI) Scheduled Distribution
A reporting solution can reduce manual follow-up by automatically distributing recurring reports to the required users.
How EasyReports Supports Tally Business Intelligence
EasyReports extends Tally reporting with a broader reporting and MIS layer.
EasyReports supports Tally.ERP 9 and TallyPrime integration, with automatic and manual import triggers and user-defined scheduling options. It also supports scheduled report distribution and Excel exports in formatted or raw tabular formats.
For businesses with more specific requirements, EasyReports supports custom fields from Tally, targets and budgets from Excel, and additional reporting dimensions such as salesperson, territory, channel, segment, brand, size, and pack size.
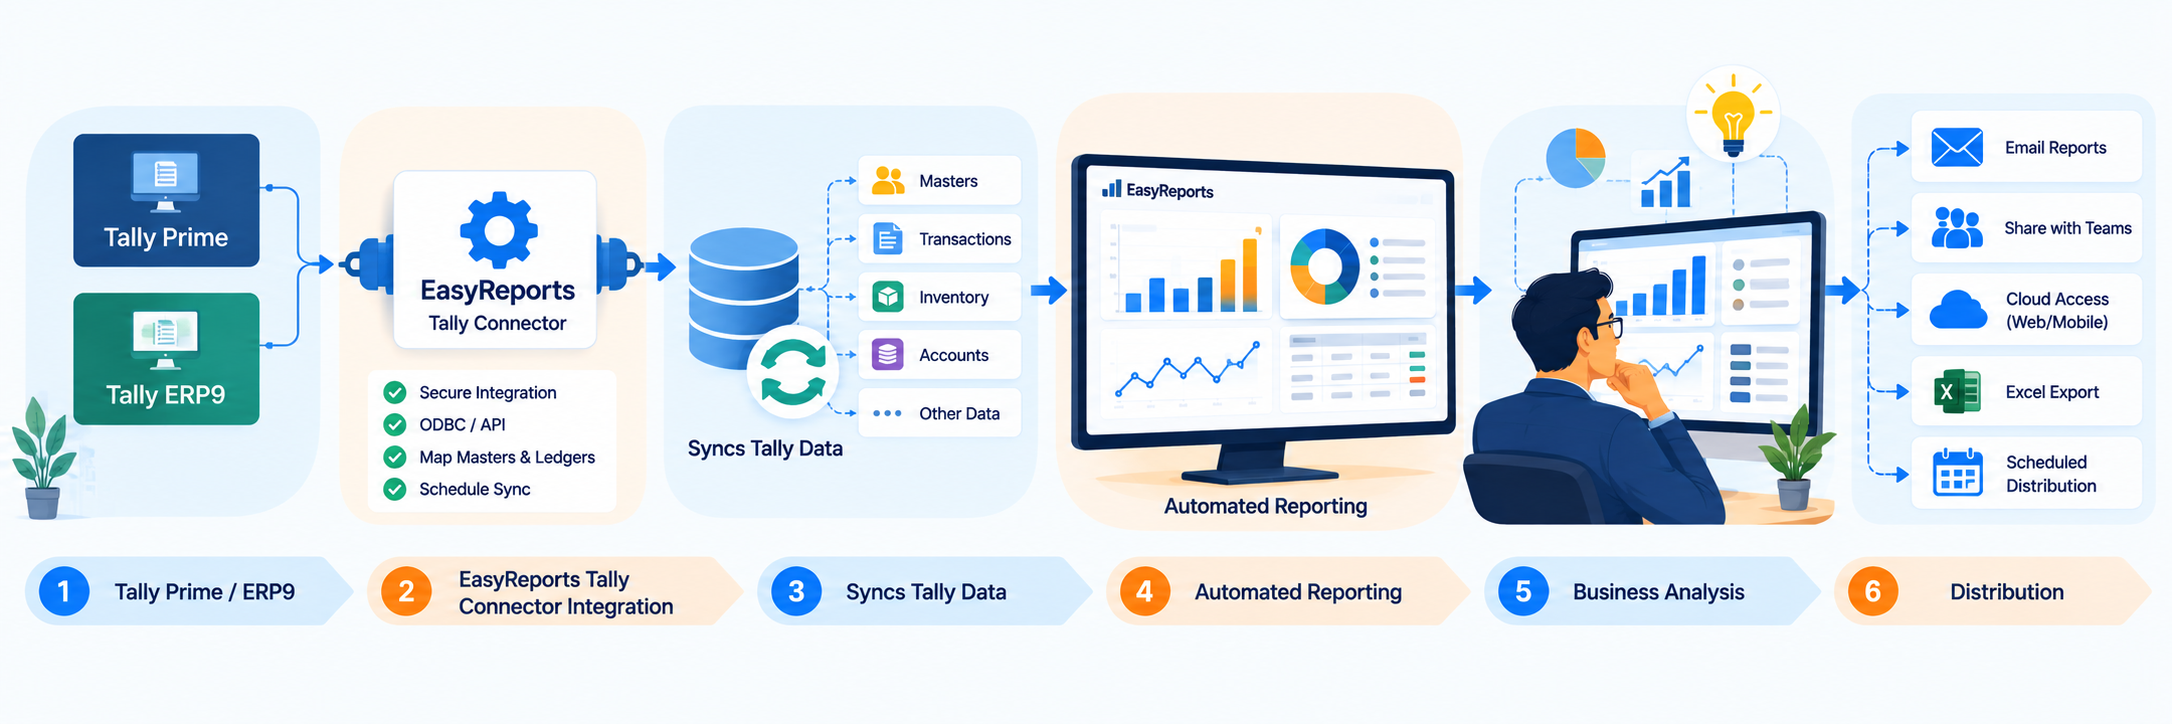
This creates a practical workflow:
Tally Prime/ ERP9 → EasyReports Tally Connector integration → Syncs Tally Data → Automated reporting → Business analysis → Distribution
The reporting catalogue also includes financial, sales, inventory, customer, supplier, production, target, and budget reports & many more.
When Should a Business Consider Tally Business Intelligence?
A business may benefit from a dedicated Tally BI or reporting layer when its reporting process starts becoming difficult to manage manually. Common signs include:
- Employees repeatedly export Tally data into Excel.
- Managers need reports from multiple business dimensions.
- Management wants dashboards instead of multiple individual reports.
- The business operates multiple companies or reporting units.
- Managers need budget-versus-actual or target-versus-actual analysis.
- Standard reports do not fully match management requirements.
- Teams need to combine Tally data with other business information.
Why Automate Tally Business Intelligence Reporting?
The more reporting grows, the more useful automation and standardized reporting workflows can become. If your business already uses Tally but still relies heavily on manual reporting, explore how EasyReports can turn your Tally data into automated reports, MIS, and dashboards. Get the demo now!
Disclaimer: Tally and Tally Prime are trademarks of Tally Solutions Private Limited. EasyReports is an independent reporting and business intelligence solution and is not affiliated with, sponsored by, or endorsed by Tally Solutions Private Limited unless expressly stated.
FAQs
1. What is Tally Business Intelligence?
Tally Business Intelligence combines Tally data with reports, dashboards, KPIs, and analytics to help businesses understand performance.
2. How does Tally Business Intelligence work?
It connects to Tally, organizes relevant data, and presents it through reports, dashboards, KPIs, and analytical views.
3. Can Tally data be used for business intelligence?
Yes. Tally data can be used with BI and reporting systems to analyze sales, inventory, finance, receivables, payables, and budgets.
4. What is the difference between Tally reports and Business Intelligence?
Tally reports provide accounting and operational information, while BI adds dashboards, KPIs, comparisons, and broader management analysis.
5. What should I look for in a Tally BI tool?
Look for Tally integration, data synchronization, custom reports, dashboards, Excel integration, and scheduled report distribution.
6. Can Tally Business Intelligence reduce manual reporting?
Yes. Automated synchronization, reporting, and scheduled distribution can reduce repeated manual exports and report preparation.
7. When should a business consider Tally Business Intelligence?
Consider it when manual reporting grows, managers need multiple business dimensions, or standard reports do not meet management requirements.
8. Can Tally Business Intelligence integrate Tally data with Excel?
Yes. A reporting layer can combine Tally data with Excel-based budgets, targets, and other business information.