EasyReports reporting solutions for trading businesses helps to simplify reporting and make faster decisions with sales, purchase, inventory, customer and financial insights. Build dashboards and reports, track key business metrics, and automate routine reporting from one platform.
Sales Reporting
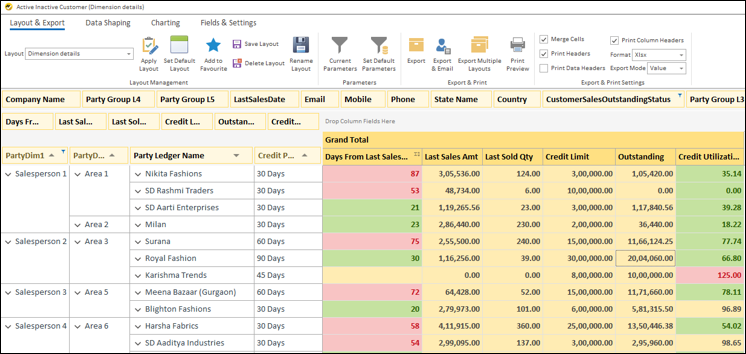
Active Inactive Customer
Helps Salespersons to
- Track the stuck payment and follow up the customers
- Follow up losing customers to get sales orders
- Track area-wise
Helps Company to
- Get salesperson or state-wise troubled customers
Other Options Available
- Company-wise segregation
- Each salesperson to access only their data
- Customer master data like email, phone number, etc.
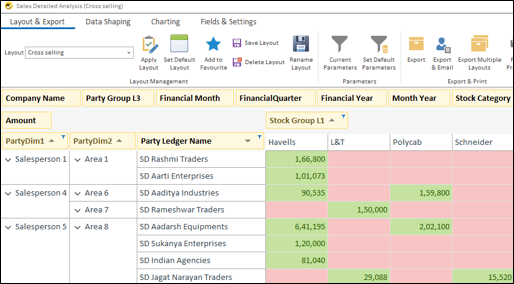
Sales Detailed Analysis (Cross Selling)
Helps Salespersons to
- Identify customers for cross selling of products
- Area-wise customer details are available
Helps Company to
- Get salesperson or state-wise customers for cross selling
Other Options Available
- Company-wise segregation
- Each salesperson to access only their data
- Customer master data like email, phone number, etc.
- Can view data for a month, quarter, year, or selected date range
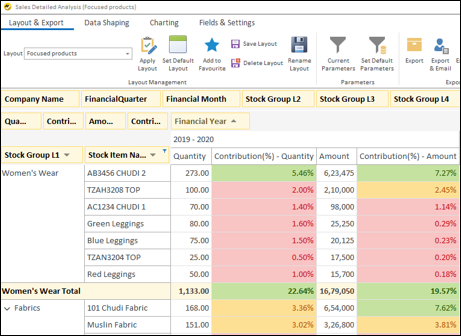
Sales Detailed Analysis (Focused Product – Company)
Helps Company to
- Get product bifurcation for each product category based on sales volume categorized in 3 brackets:
- More than 5%
- 2–5%
- Less than 2% of total sales
Other Options Available
- Company-wise segregation
- Can be seen monthly, quarterly, yearly, or for a selected date range
- Option to filter Top N items for each category
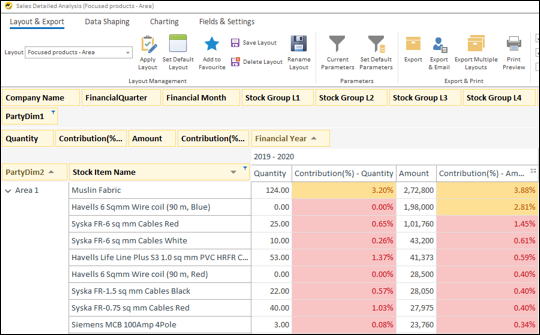
Sales Detailed Analysis (Focused Product – Area)
Helps Company to
- Get product bifurcation for each area based on sales volume categorized in 3 brackets:
- More than 5%
- 2–5%
- Less than 2% of total sales
- Helps in identifying top selling products in each area
Other Options Available
- Company-wise segregation
- Can be seen monthly, quarterly, yearly, or for a selected date range
- Option to filter Top N items for each category
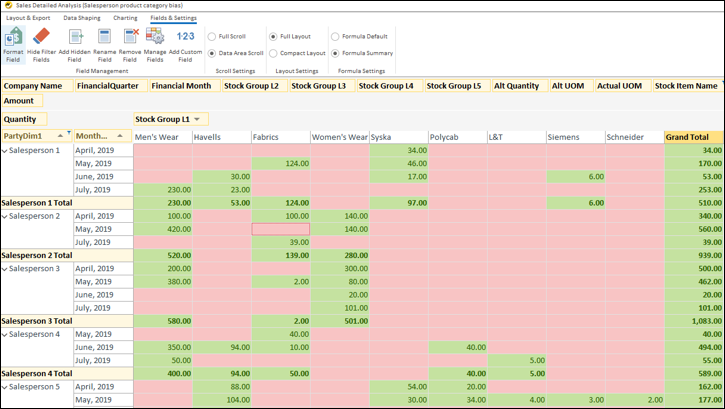
Sales Detailed Analysis (Salesperson Stock Category Bias)
Helps Company to
- Identify stock biasness of a salesperson (e.g., selling items only from certain categories)
Other Options Available
- Company-wise segregation
- Can be seen quarterly, yearly, or for a selected date range
- Summarize at salesperson level
- Option to view at customer or product level
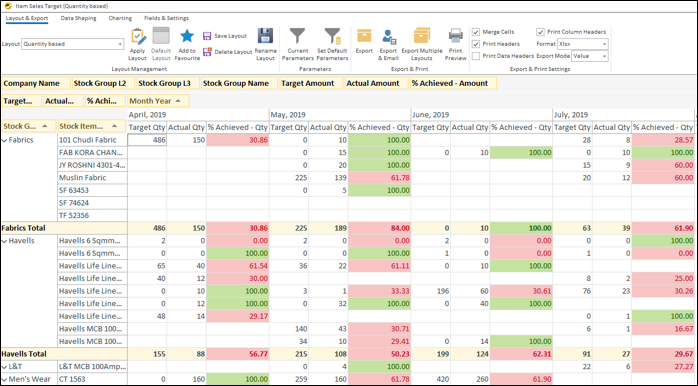
Item Sales Target vs Actual
Helps Company to
- Track item-wise target vs actual
- Identify items whose targets are not achieved
Other Options Available
- Can be seen quarterly or yearly
- Company-wise segregation
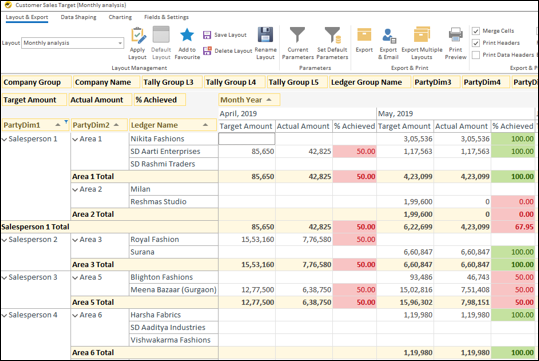
Customer Sales Target vs Actual
Helps Salespersons to
- Track their target achievement
- Identify customers for whom target is not achieved
Helps Company to
- Track salesperson and customer-wise target vs actual
- Identify salespersons whose targets are not achieved
Other Options Available
- Company-wise segregation
- Can be seen quarterly or yearly
- Salesperson can use this report with cross selling report to identify items to pitch to customers
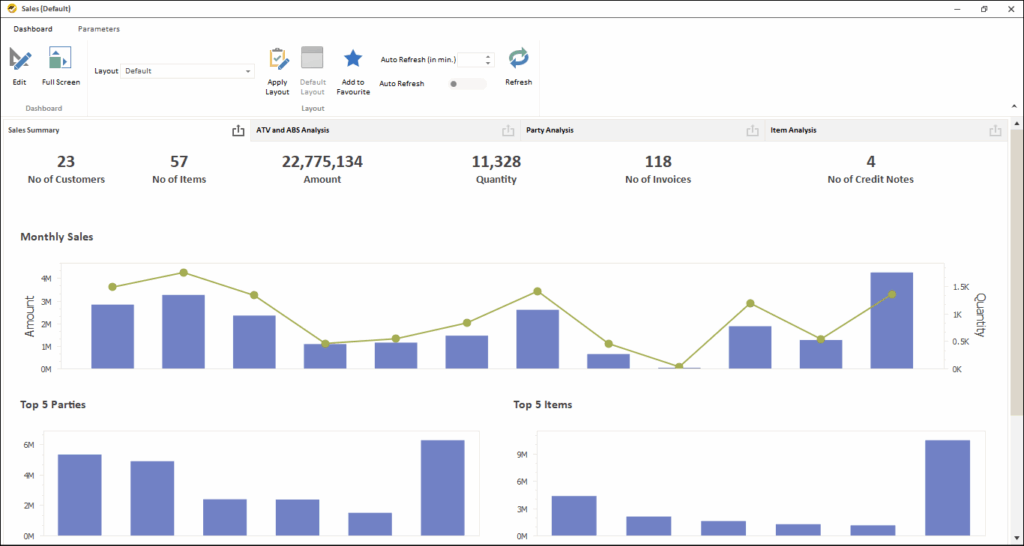
Sales Dashboard (Overview)
Helps Company to
- Analyze sales data by party, item, month, and company
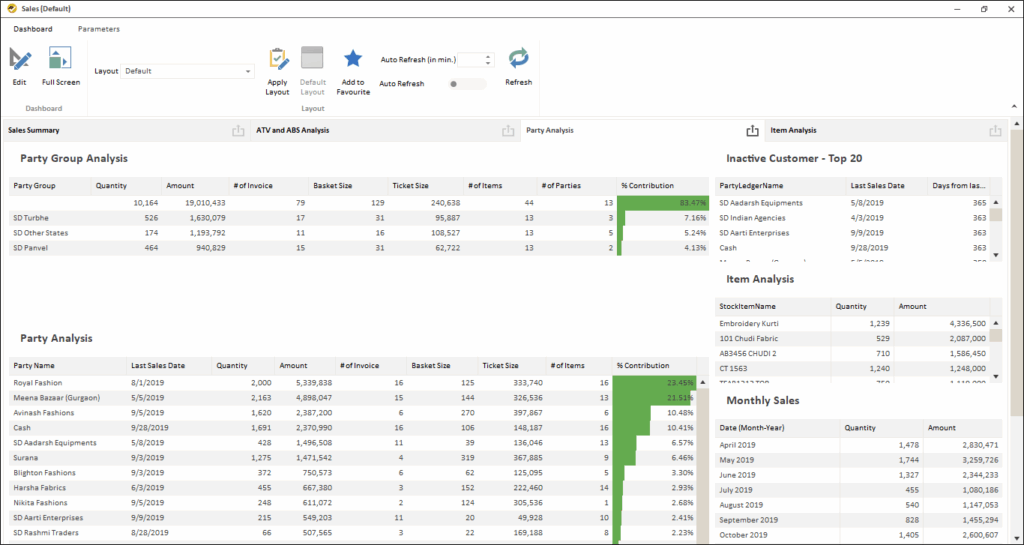
Sales Dashboard (Party Analysis)
Helps Company to
- Get item-wise or month-wise sales breakup
- Analyze sales data for a particular party group or individual party
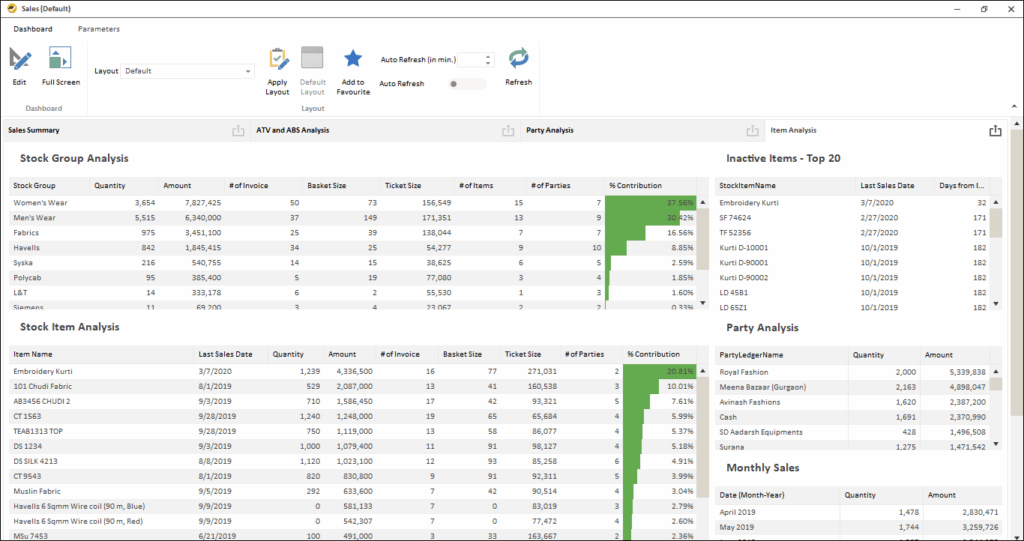
Sales Dashboard (Item Analysis)
Helps Company to
- Analyze sales data for a particular item group or individual item
- Get party-wise or month-wise sales breakup
Purchase Reporting
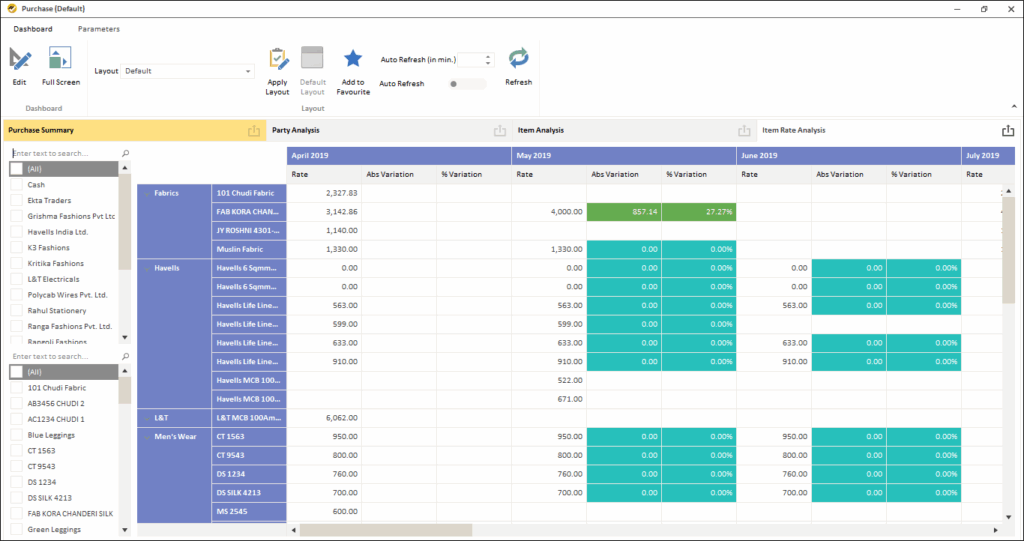
Purchase Dashboard (Item Rate Analysis)
Helps Company to
- Identify purchase rate variation month on month
Other Options Available
- Select a vendor and view product-wise rate variations
- Select a product and view vendor-wise rate variations
- View quarterly or yearly trends
Customer Reporting
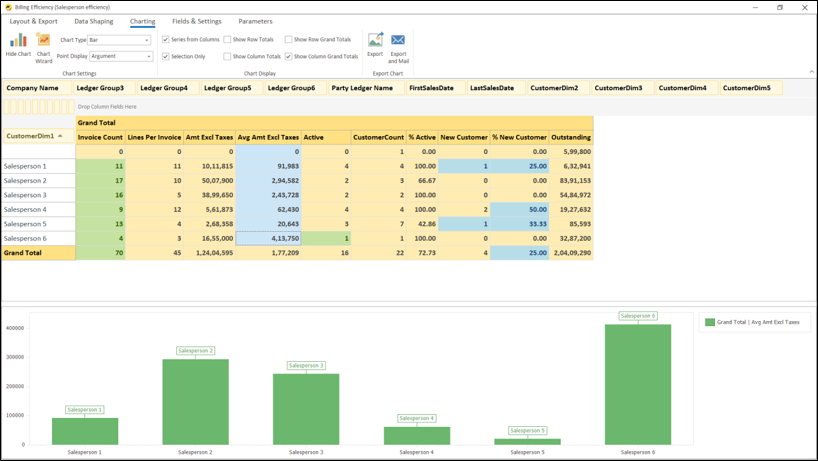
Billing Efficiency (Salesperson)
Helps Company to
- Track billing efficiency using metrics: total invoices, average ticket size, new customers, outstanding, last sales
Helps Salespersons to
- Track billing efficiency of their parties
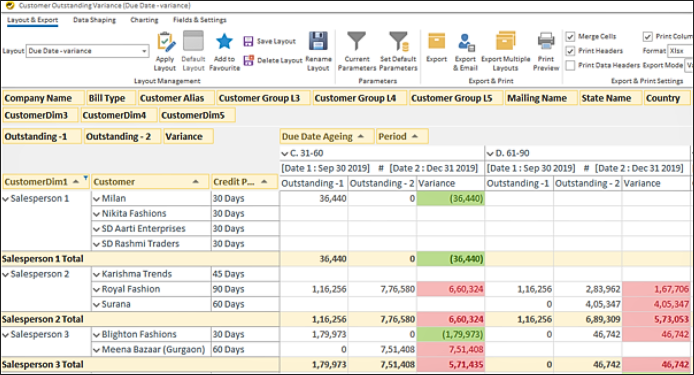
Customer Outstanding Variation
Helps Salespersons to
- Identify parties with increasing/decreasing credit days
Helps Company to
- Ensure customer outstanding stays within credit limits
- Minimize bad debts
- Better manage working capital
- Summarize at salesperson level
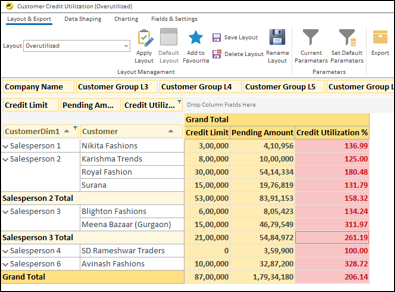
Customer Credit Utilization
Helps Salespersons to
- Identify customers who have exceeded credit limits
Helps Company to
- Track customer credit utilization
- Keep customers within approved credit limits
- Better manage working capital
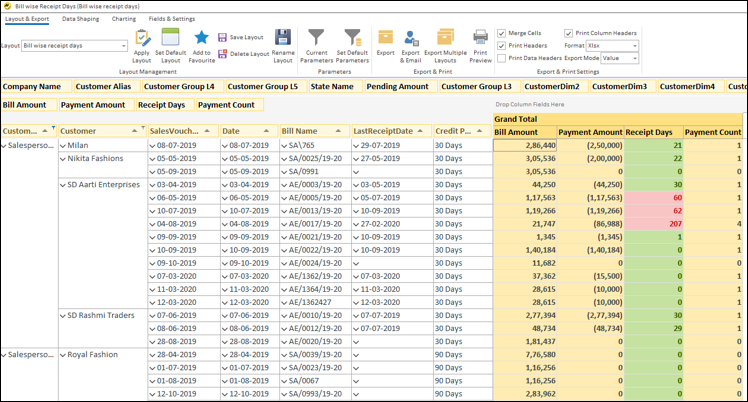
Bill-wise Receipt Days
Helps Salespersons to
- View bill-wise receipt days vs credit days for customers
- Track credit performance
Helps Company to
- Identify customers with troubled payment history
Inventory Reporting
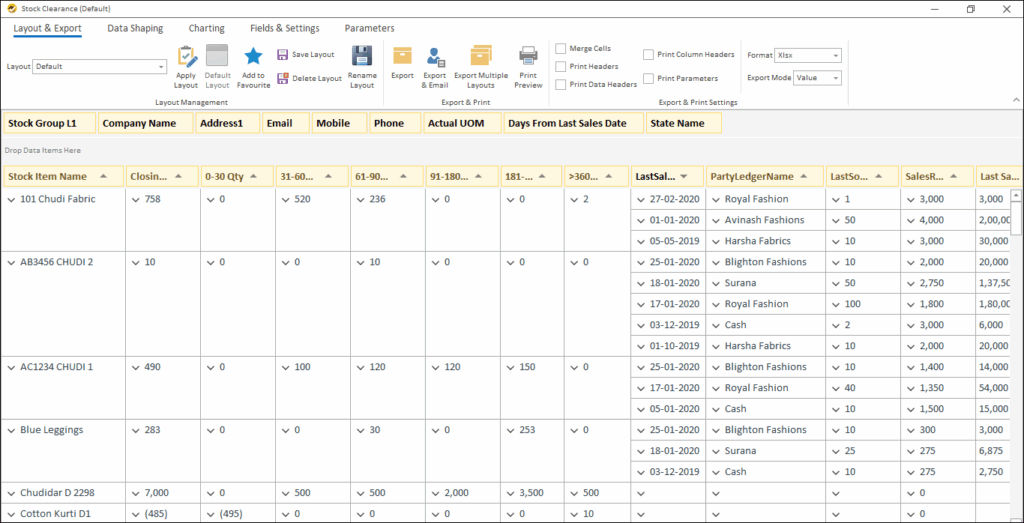
Stock Clearance
Helps Company to
- Identify customers to sell stock to during clearance sales
- Decide pricing based on last sale data
Other Options Available
- Filter by stock category
- Filter by ageing (e.g., items in stock > 360 days)
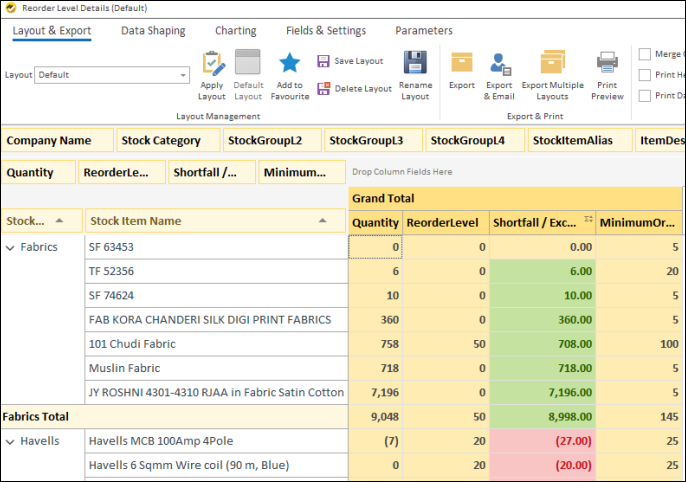
Reorder Level Details
Helps Company to
- Identify items below reorder level for timely purchasing
Other Options Available
- Filter by reorder status
- Company-wise breakup
- Filter by stock category
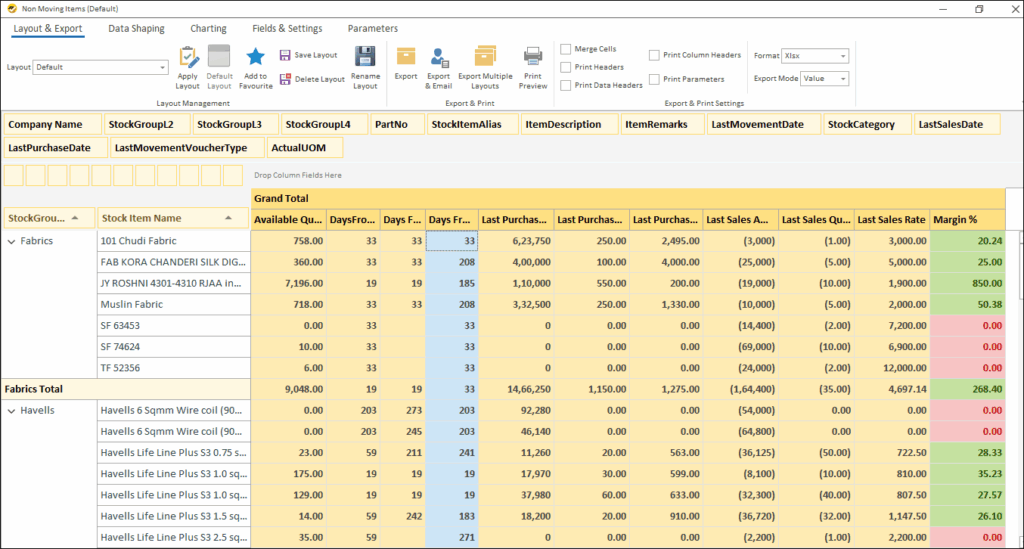
Non-Moving Items
Helps Company to
- Identify items not sold for N days
Other Options Available
- Filter by days not sold
- Company-wise filter
- Filter by stock category
Order Processing
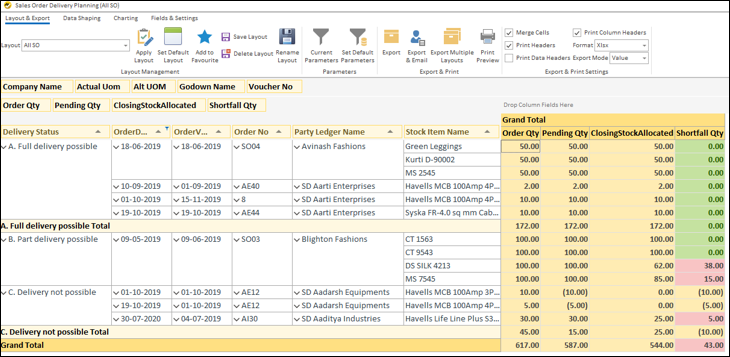
Sales Order Delivery Plan
Helps Company to
- Plan pending sales orders
- Identify fully, partially, and undeliverable orders
- Plan procurement accordingly
Other Options Available
- Filter undeliverable orders
- Filter by company, stock category, or stock item
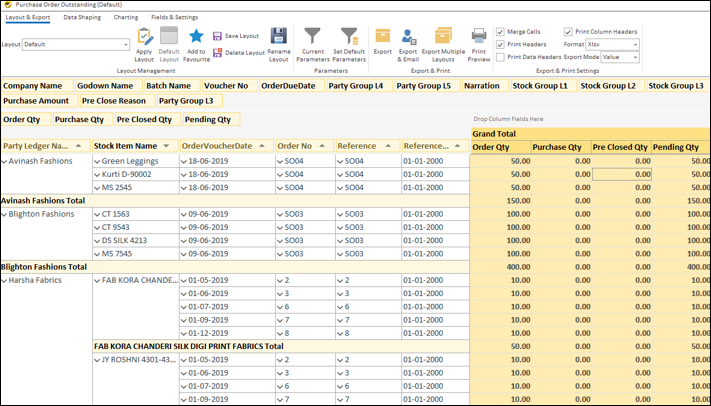
Purchase Orders Outstanding
Helps Company to
- Track pending POs
- Get status of delayed deliveries
Other Options Available
- Filter by vendor, company, stock category, or item
Financial Reporting
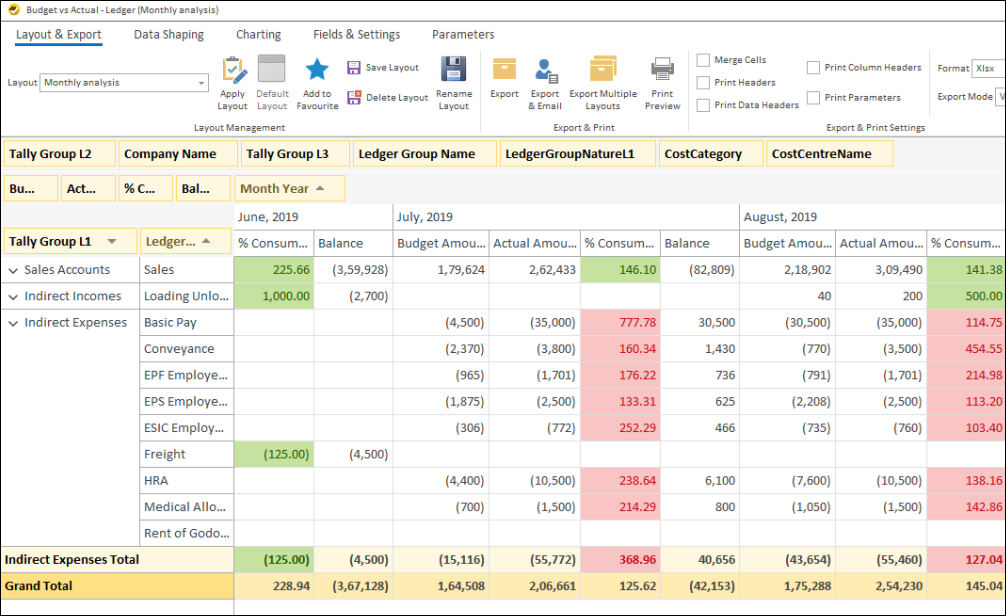
Budget vs Actual
Helps Company to
- Compare actual vs budgeted figures
- Track over-expensed or under-revenue areas
Other Options Available
- Filter by company
- Summarize by group
- View quarterly or yearly
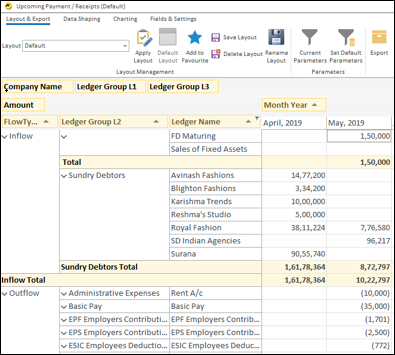
Upcoming Payments and Receipts
Helps Company to
- Track upcoming payments and receipts
- Plan working capital needs
Other Options Available
- Filter by company
- Summarize by group
Configuration
- Upload recurring yearly payments
- Upload monthly estimated variable costs
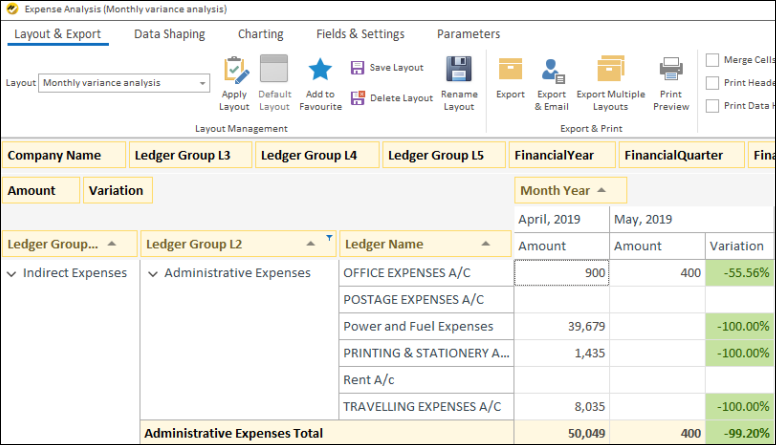
Expense Analysis
Helps Company to
- Track expenses
- Analyze monthly variations
- Highlight threshold-exceeding items
Other Options Available
- Filter by company
- Summarize by group
- View quarterly or yearly
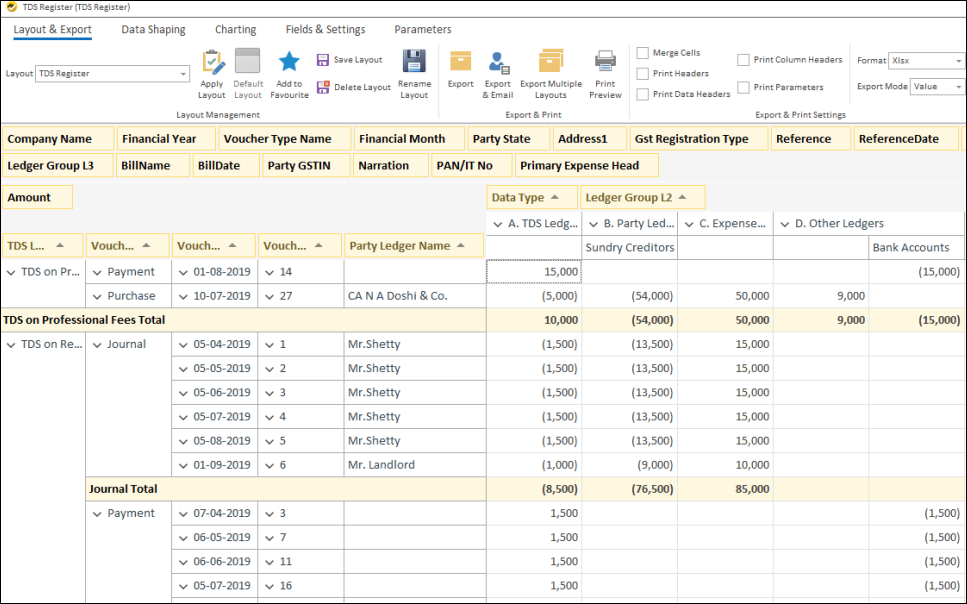
Columnar TDS Details
Helps Company to
- Track all TDS entries
- Get details by ledger
- Reconcile data with party and expense ledgers
Other Options Available
- Filter by company
- Summarize by group
- View by date range
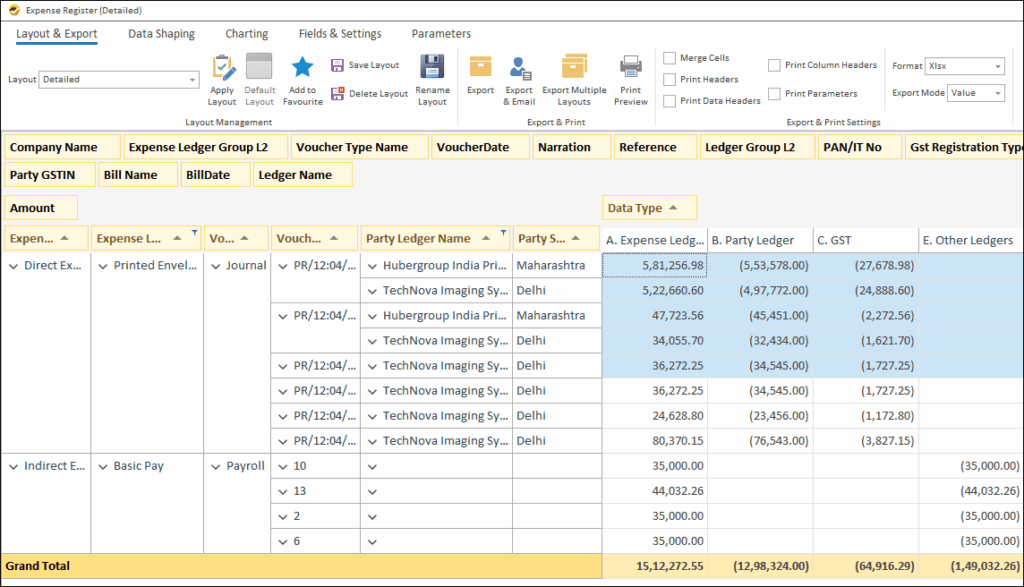
Expense Register
Helps Company to
- Track expense entries
- View details by expense ledger
- Reconcile with party, TDS, and GST ledgers
Other Options Available
- Filter by company
- Summarize by group
- View by date range
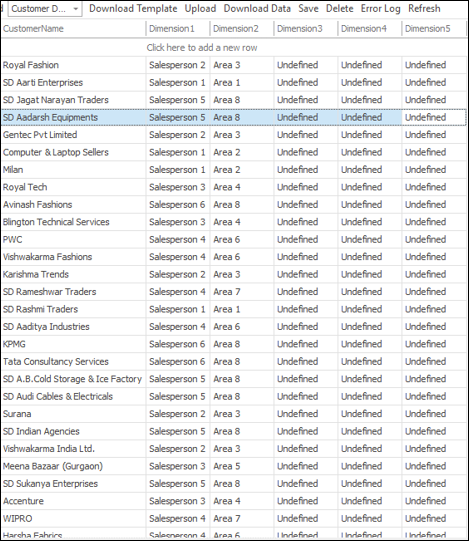
Additional Data – Customer Dimension
- Option to upload additional customer/item dimension data
- Upload up to 5 fields (salesperson, area, region, customer type, etc.)
- All fields appear in standard customer reports
- Upload via Excel template
- Download existing data to update
- Manually update single rows if needed