August 18, 2018
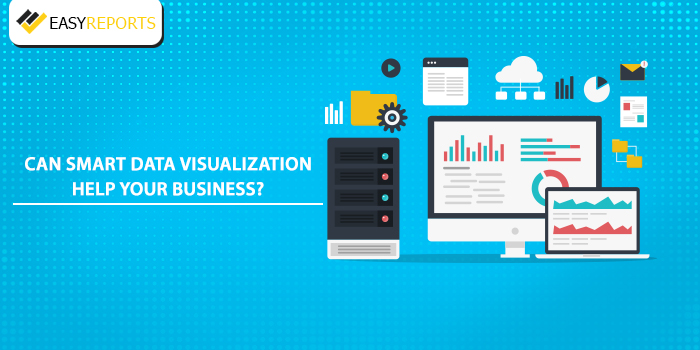
Smart data visualization allows users to analyze and present data gathered from multiple sources in a cohesive manner. Smart data visualization tools are designed to translate complex big data into understandable insights. An example of traditional data visualization is the use of maps, charts and diagrams to present complex information in a graphical or pictorial format. Generally, data visualization is static and not interactive. It can also be prone to human error. Business users have to depend on specialists or data experts to gain any insights. In this blog article, we will discuss how can smart data visualization help your business.
With smart data visualization tools, business users can gather various data components to analyze, share and present information. They do not have to depend on any technical assistance from data analysts. Smart data visualization can help an organization to clarify a problem, identify an opportunity or help to make a decision. It can compare different patterns and trends and make informed predictions about future outcomes. It can improve business intelligence, data discovery and analytics.
Some key benefits of smart data visualization are:
Gain insights to customer behavior
It is important to identify and understand market trends so that a business can communicate with customers more effectively. With advanced digital technology entering the scene, much of the market knowledge is data driven today. Salespeople and marketing teams have neither the required technical knowledge nor the time to go through large spreadsheets of complex data.
EasyReports BI tool comes with smart data visualization features which help a business to identify important customer information. Its Pivot Style reporting does a quick analysis of your data (which is fed into the toll through Tally ERP9 integration); top, bottom, ranking and contribution analysis of data without any manual intervention gives you the edge of being faster and smarter and pushes your organization towards increased productivity. Business users may identify which products are selling best, understand purchasing behavior, and gather customer sentiment about newly launched products.
Share Information
With smart data visualization, a business organization can integrate its ERP, CRM and other data management systems. This makes it easy to access and share all kinds of business information. Users can have a complete overview of all customer and company data. It can help them to find any correlations between back-office operations like manufacturing or delivery and the impact it may have on the business performance like sales or customer service.
EasyReports BI along with Tally Integration tool can similarly integrate an organization’s transactional data input points and can reveal patterns across departments, allowing users to improve the work process system. Employees get access to new ways of viewing business data, which enables them to make better and informed decisions.
EasyReports BI with its Tally Integration capability gives users access to real-time data visualization which empowers a business and drives growth by directly contributing to the top line of the organization. To know more about its benefits, log on to www.easyreports.in or send a mail to contact@easyreports.in