February 20, 2018
For any organization, be it big or small, it is important to get reports effortlessly whenever required. Though Tally can help a lot in accounting related tasks, report making and that too in your defined format is not its forte. For that, you might need a BI tool that can help generate quick MIS reports in an easy-to-fetch & user friendly UI format. Needless to mention, a BI tool with Tally integration feature would be the right choice here to go for.
You can save productive man hours by using excel to tally import utility feature and then Tally data getting automatically integrated to your BI tool without any manual intervention, to generate the reports you need.
EasyReports is an intelligent choice to opt for as because with the help of tally integration it can automate your reporting tasks and increase productivity of your organization.
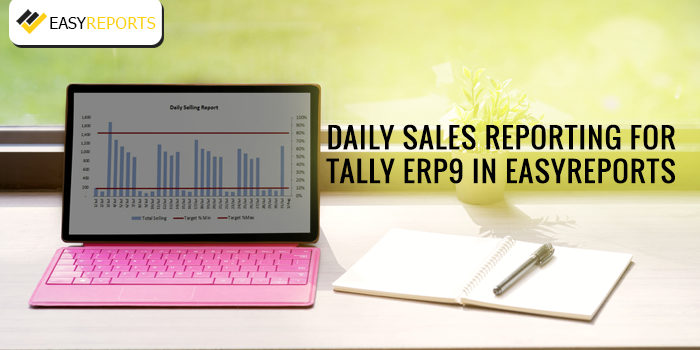
Daily sales reporting made easy through EasyReports
If you are not using any Business Intelligence (BI) tool for your organization, you are perhaps missing the benefits, one of those being – real time daily sales report generation. Here, you can generate salesperson-wise reports and track the productivity of your sales force and optimize it accordingly.
- There’s a feature in EasyReports that lets you analyze sales reports according to the following dimensions –
- Timeline
- Customer location
- Product (group wise and SKU item wise), etc.
This can help you do a SWOT analysis of your organization and take necessary actions in the right time. This feature of EasyReports to drill down to actionable from analyzing data in different dimensions directly contributes to a profitable ROI. EasyReports also provides stock ageing analysis in Tally ERP 9 and gives a clear picture of inventory analysis of your business.
- If you want, you can segregate and obtain reports according to dimensions like segment, channel, region, area and so on. This can help you get specific and precise reports and gather more accurate information about the fast moving items, which zones/ regions are profitable for your business, which channel is effective for you and so on.
- You can also fetch information on the basis of timeline. Like, if you enter the date ‘from’ to ‘to’, you’ll be able to get the sales report for that period filtered. If you are generating reports according to the time span, you can track the growth or deterioration of sales figures of your organization easily.
- You can also get daily, monthly or yearly sales report generated and emailed directly to the concerned person as per the scheduled time configured.
If you have targets set, it is easier to do a comparison in BI for Target Vs Achieved KPIs. The BI tool sets realistic targets and helps compare actual figures vs. target figures so that one can easily figure out the areas where one is lagging behind. One can compare these figures in areas like Total sales, sales by salespersons, Quantity of products sold, zone wise sales and many more.
- Apart from many other interactive features, the sales report also has features that can segregate active or inactive product. Inactive products are the products that have not been sold for ‘user defined’ number of days. The product is categorized according to the user’s logic. These products can be then labeled as slow moving products and the top management can then take necessary actions to optimize their inventory accordingly.
- Each and every sales report can be customized according to the organization using drag and drop feature. One can define time dimensions, charting options, filter options, etc. in a report and make it more analytical and useful. You can also add logics that can help segregate data, analyze it and present it as a report. There are a number of custom fields that can be added to a layout to make the sales report more personalized.
- You can also make sales comparison from month to month, year to year or one quarter to another easily using the tool with real time data from tally.
- EasyReports also provides sales order tracking by using its ‘sales order tracking’ feature – where you can get visually rich analytics at your fingertips in a click without any hassle.
If you have a tool like EasyReports, you would never need to worry about daily sales reporting, as the tool can fetch real time data from Tally and can create pre-defined/ custom MIS reports in a click giving your business an edge over others.
