Track production, plan raw materials and monitor efficiency – all in one reporting platform.
Detailed Report Descriptions
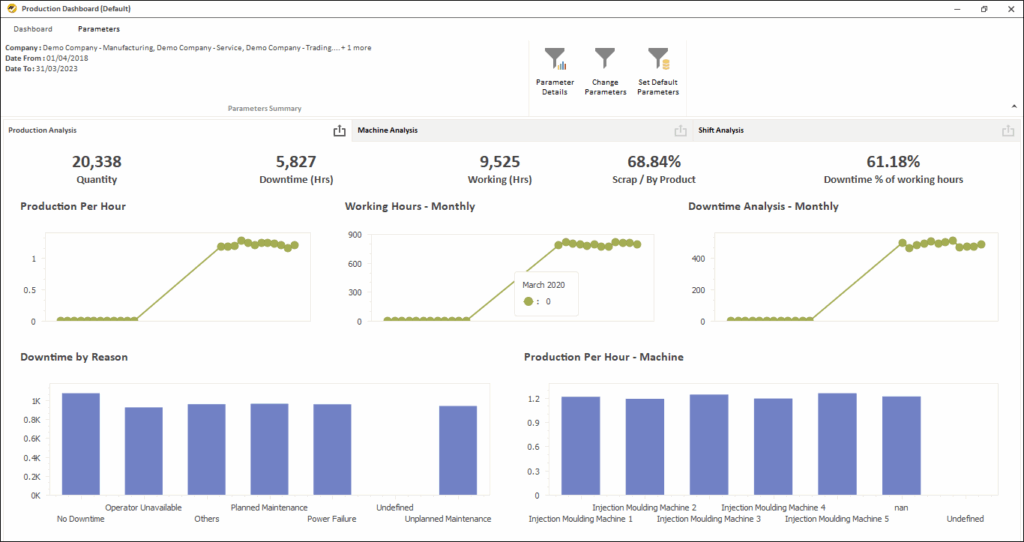
Production Dashboard (Production Analysis)
Helps Company To:
- Get production analysis by different dimensions like Item, Machine, Operator, Shift, Month, etc.
- Select a shift, machine, month, or other dimension and apply dashboard filters for that dimension
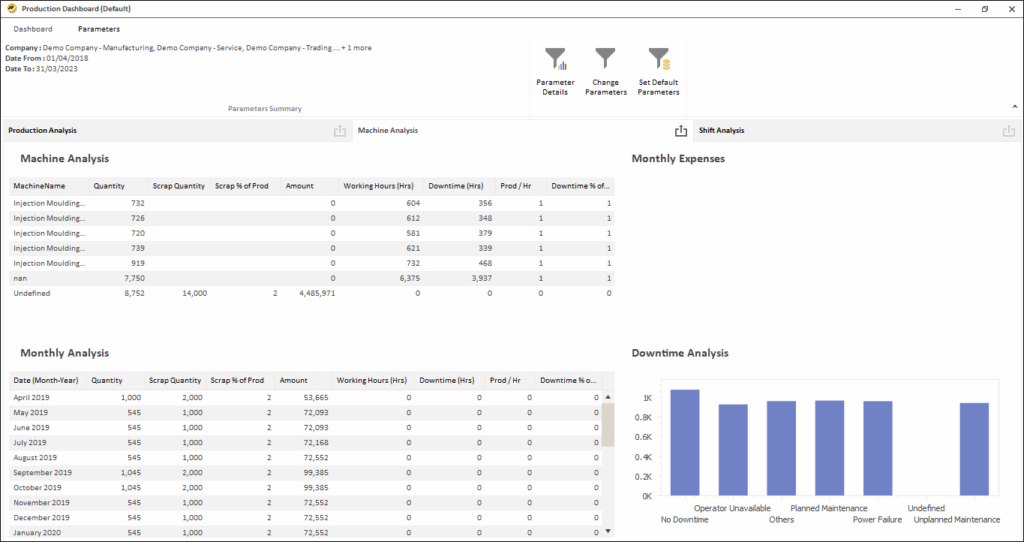
Production Dashboard (Machine Analysis)
Helps Company To:
- Get machine-wise detailed analysis
- Track downtime by each machine
- View machine analysis for a particular month or monthly analysis for a particular machine
- Track monthly maintenance expenses on each machine
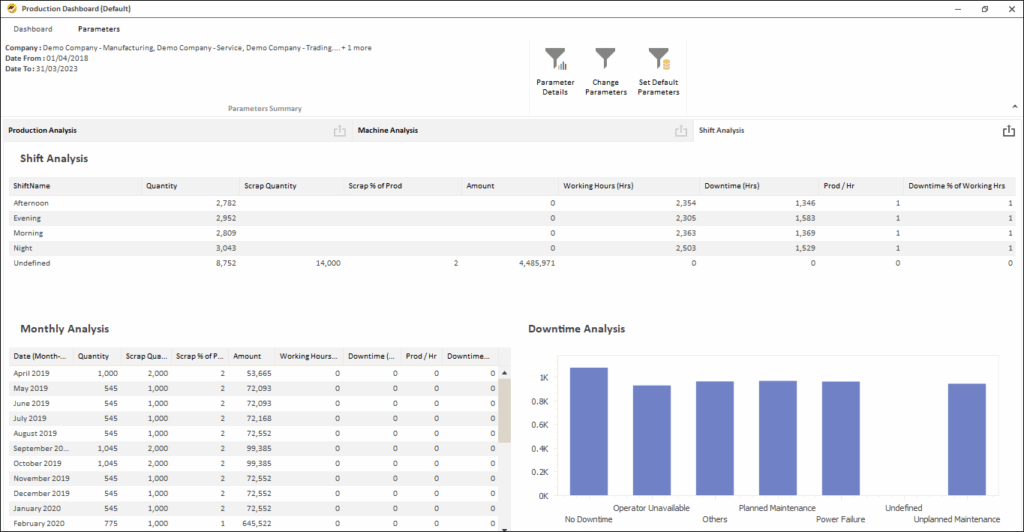
Production Dashboard (Shift Analysis)
Helps Company To:
- Get shift-wise detailed analysis
- Track downtime by each shift
- View shift analysis for a particular month or monthly analysis for a particular shift
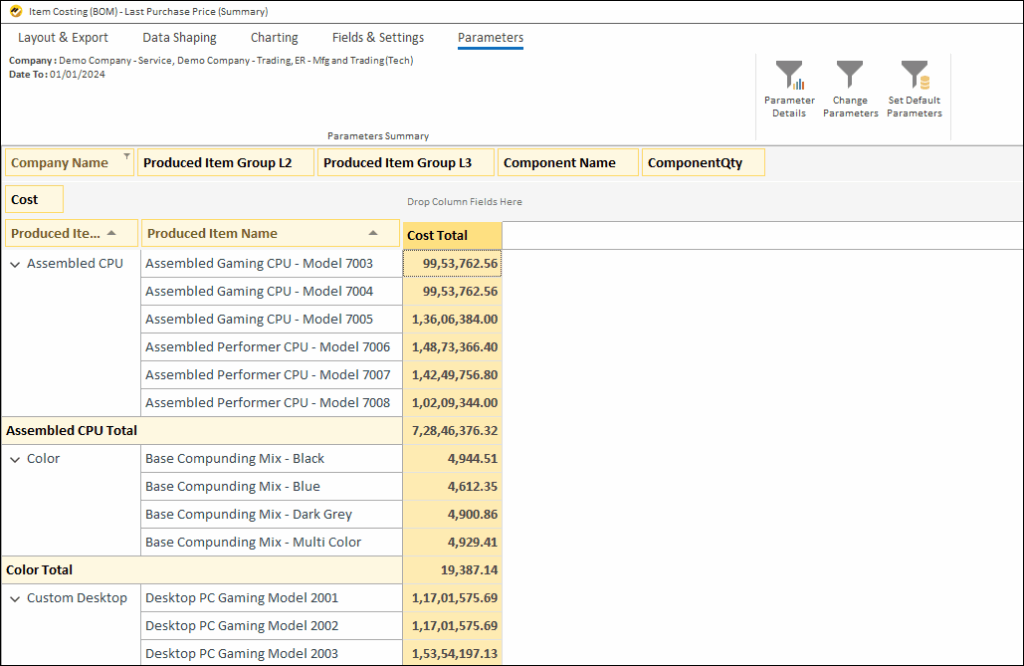
Item Costing (BOM) – Last Purchase Price
Helps Company To:
- Get costing for finished goods or semi-finished goods based on the last purchase price of raw materials
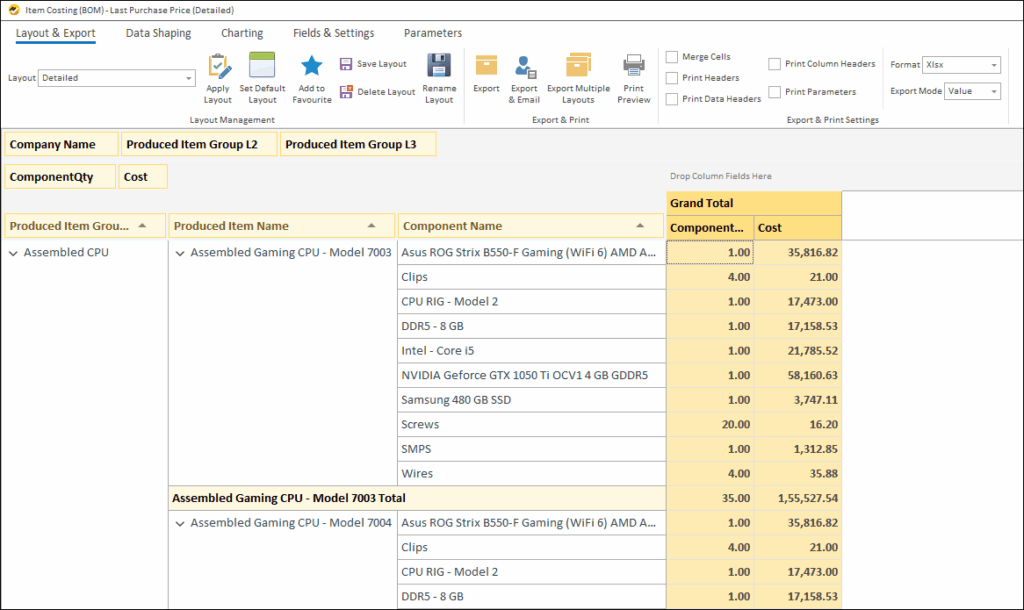
Item Costing (BOM) – Last Purchase Price (Detailed)
Helps Company To:
- Get costing for finished or semi-finished goods based on the last purchase price of raw materials
- Get component-wise cost breakup
- Get the latest cost of the product
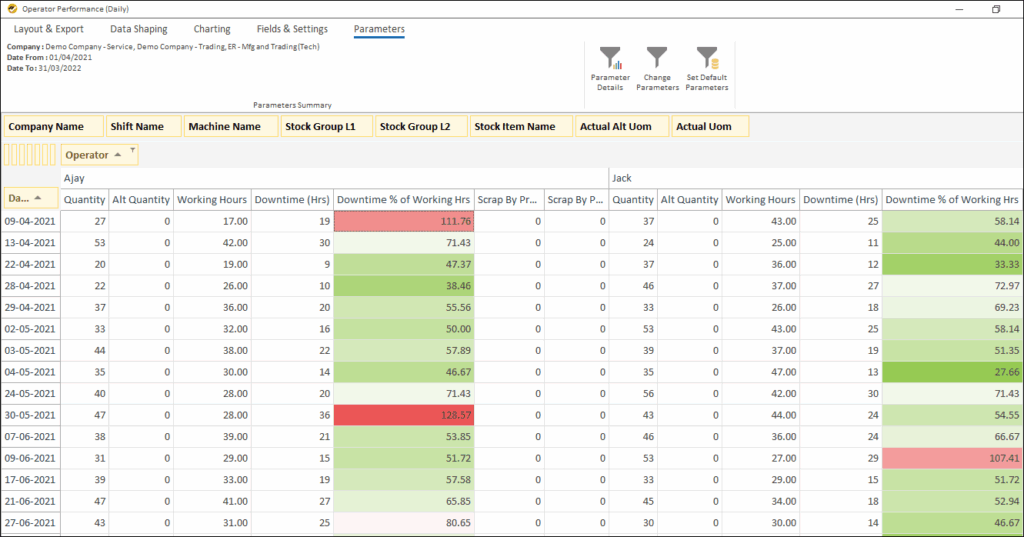
Operator Performance (Daily)
Helps Company To:
- Track daily operator performance in terms of production, productive hours, and rejections
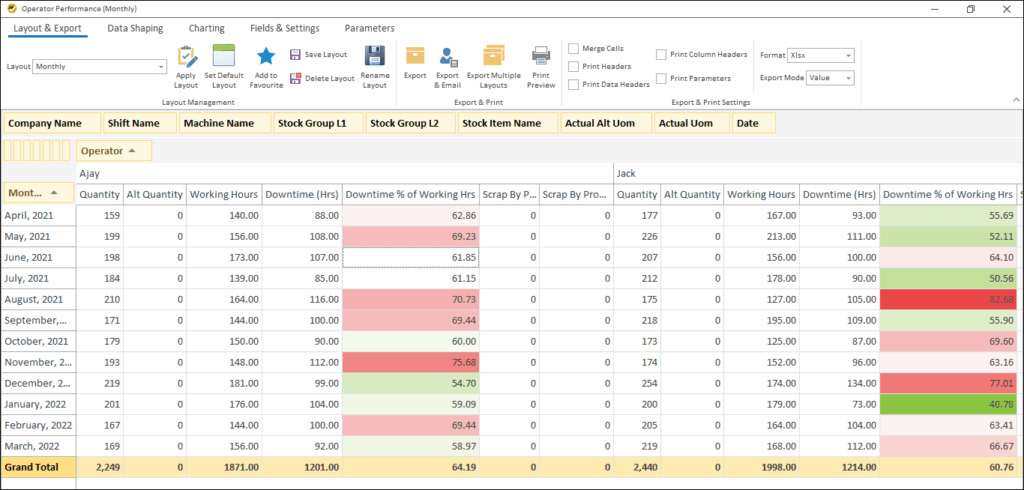
Operator Performance (Monthly)
Helps Company To:
- Track monthly operator performance in terms of production, productive hours, and rejections
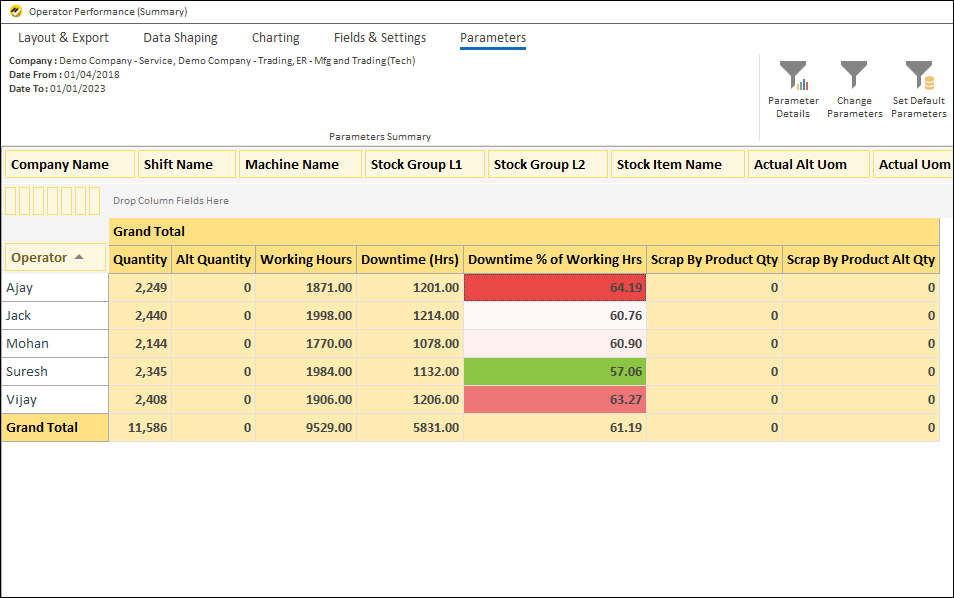
Operator Performance (Summary)
Helps Company To:
- Track operator performance for a selected period in terms of production, productive hours, and rejections
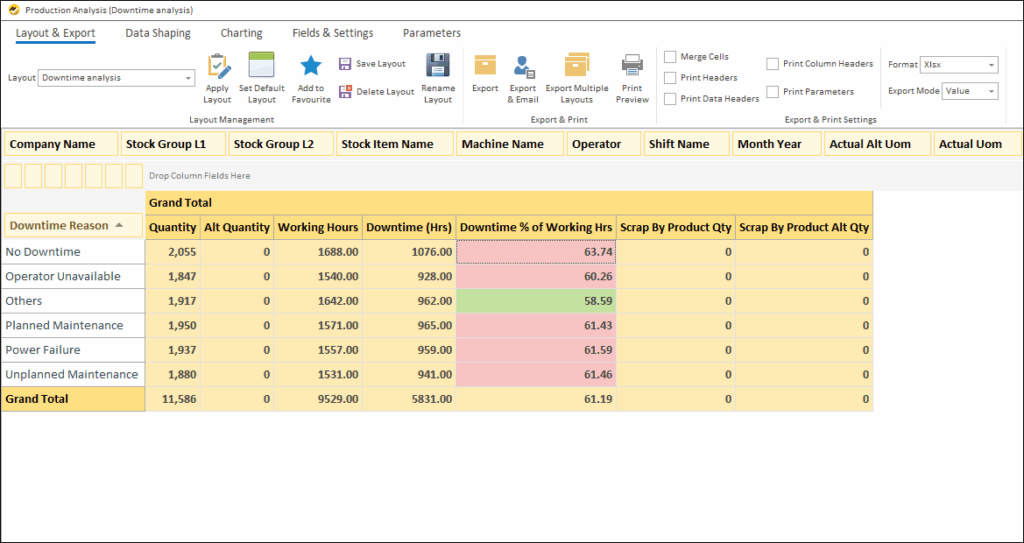
Production Analysis (Downtime Analysis)
Helps Company To:
- Track downtime by different reasons
- Take appropriate steps to better manage downtime
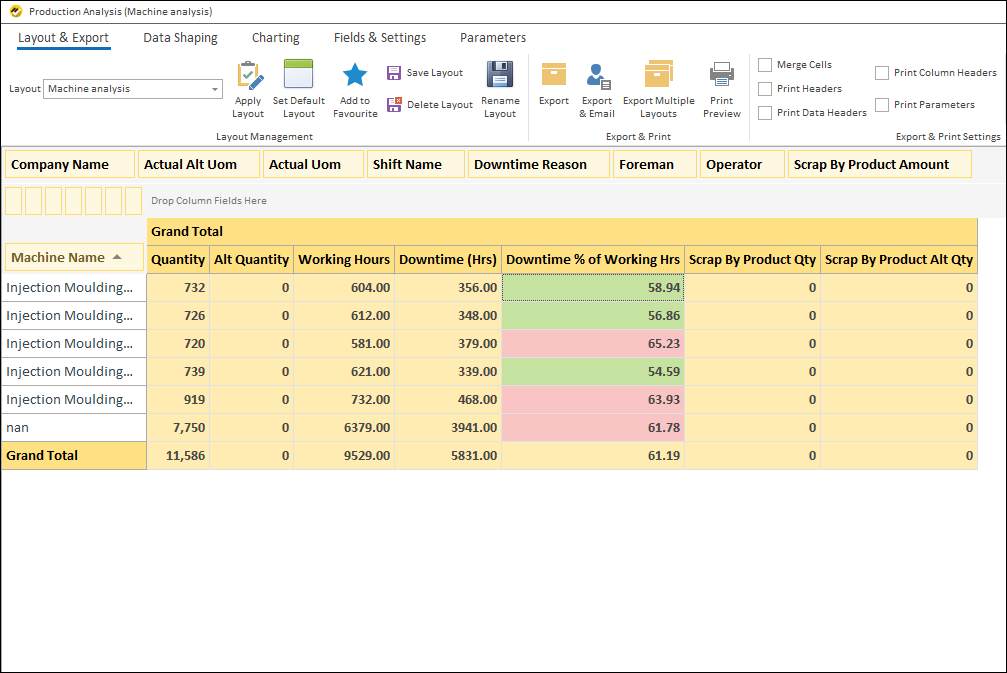
Production Analysis (Machine)
Helps Company To:
- Get machine-wise analysis
- Calculate downtime as a % of working hours per machine
- Identify machines with high downtime
Other Options Available:
- Get month-wise, quarter-wise, or date-wise breakup for machines
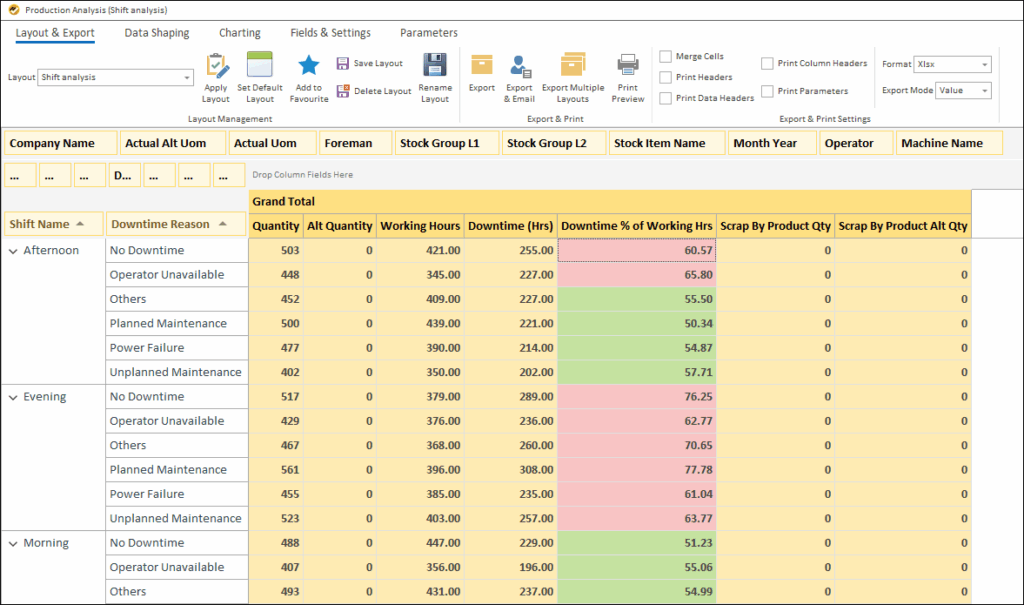
Production Analysis (Shift)
Helps Company To:
- Identify shifts with high downtime and reasons for it
- Get top reasons for downtime for a selected shift
Other Options Available:
- Get month-wise, quarter-wise, or date-wise breakup of shifts to identify repeated reasons for downtime
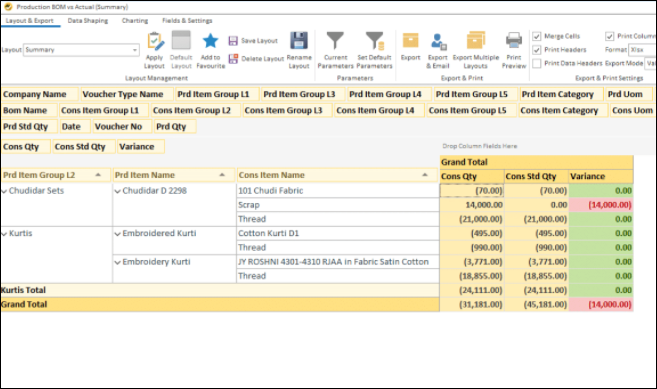
Production BOM vs Actual
Helps Company To:
- Track actual consumption vs BOM-standard consumption for each produced item
- Identify production entries where consumption variance exists
Other Options Available:
- Get data for each production voucher by date
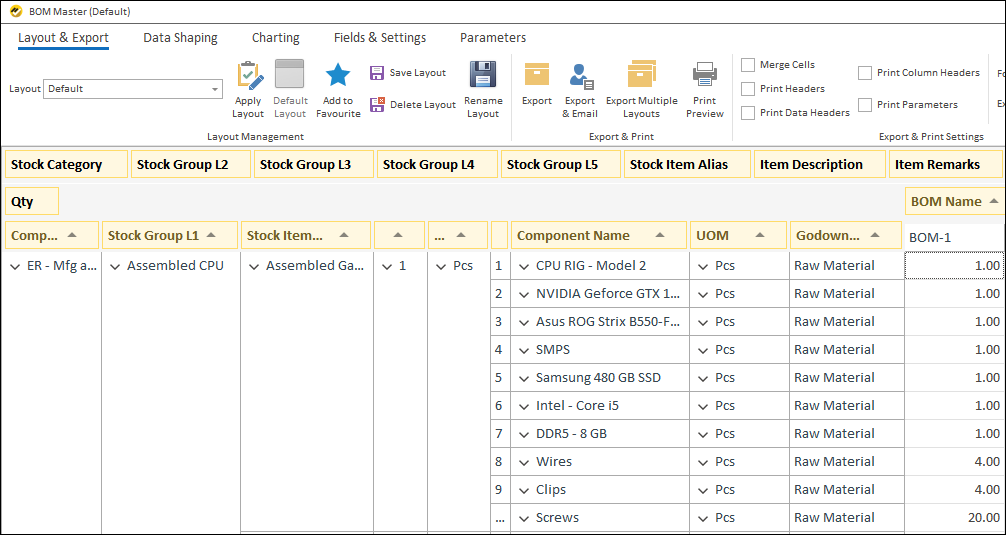
BOM Master
Helps Company To:
- Get BOM breakup for finished and semi-finished goods
Other Options Available:
- In case an item has multiple BOMs, separate breakdowns are available for each