
November 7, 2025
How to automate financial reports for small businesses in India? To automate financial reports for small businesses in India, connect your ERP systems such as Tally, SAP Business One, Microsoft NAV, or Business Central with a BI reporting tool like EasyReports. This enables businesses across India to generate accurate financial reports automatically while reducing manual work and improving decision-making.
Thousands of small businesses across India still rely on Excel spreadsheets and manual processes to prepare financial reports. As businesses grow, manual reporting becomes time-consuming and increases the risk of errors. Automating financial reports helps Indian businesses save time, improve accuracy and gain real-time financial visibility.
Why Manual Financial Reporting Is Killing Your Productivity?
- The Hidden Costs Nobody Talks About
Manual reporting introduces errors at every step. A misplaced decimal here, a wrong formula there, and suddenly your profit margin percentage looks lower than it actually is.
Then there’s the delay factor. By the time you finish compiling last month’s financial report, you’re already 15 days into the new month.
- The Spreadsheet Trap
When you have data scattered across for accounting, separate sheets for budgets, another system for inventory and maybe Google Sheets where your sales team tracks targets, getting everything into one coherent financial report becomes a puzzle.
The Right Way to Automate Financial Reports for Small Business
Step 1: Connect Your Data Sources
This is where many small businesses in India get stuck. Financial data is often spread across Tally, Excel, inventory software, and other business applications.
The solution? Use a reporting tool that directly connects to your existing systems.
For example, if you’re using Tally, you need a tool that can read Tally, SAP B1 data in real-time without manual exports.
EasyReports does exactly this. It connects directly to Tally, SAP Business One, Microsoft NAV and Business Central & other data sources.
Step 2: Map Your Chart of Accounts
Most modern tools like EasyReports come with pre-built mapping for standard financial statements (Balance Sheet, P&L, Cash Flow). About Auto Mapping of 80-90 % of the ledgers to reporting heads based on pre-defined rules.
Step 3: Create Report Templates
This is where automation really starts to shine.
Instead of building each financial report from scratch every month, you create templates once. These templates define:
- How to structure it (rows, columns, groupings)
- What calculations to perform (margins, ratios, variances)
- How it should look (formatting, charts, colors)
Most small businesses need these core financial reports: Most small businesses in India require these financial reports for daily operations, GST compliance, business planning and management decision-making.
I) Income Statement (P&L): Shows revenues, expenses, and profit for the period. Include month-to-date, quarter-to-date, and year-to-date views.
II) Balance Sheet: Assets, liabilities, and equity at a point in time. Great for understanding your financial position.
III) Cash Flow Statement: Where money came from and where it went. This is often more important than profit for small businesses.
IV) Budget vs Actual: Compares what you planned to spend and earn versus what actually happened. Essential for staying on track.
With EasyReports, you can create these templates using a drag-and-drop interface. No coding required. The system even comes with pre-built templates for common financial statements, so you can start with those and customize them to match your specific needs.

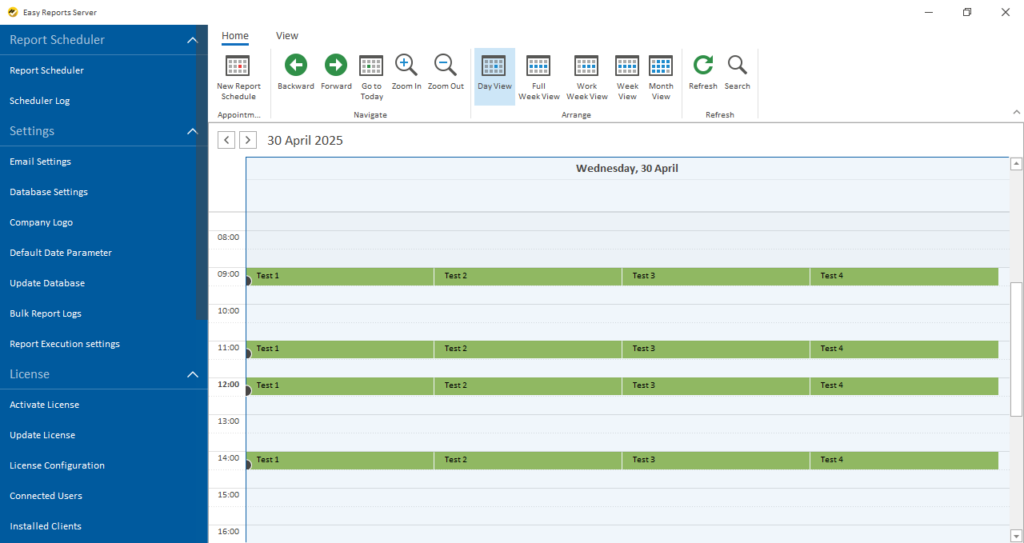
Step 4: Set Up Automated Scheduling
With EasyReports, schedule reports to be created and sent automatically.
Instead of preparing reports every week or month, you can fix a time and the system will do it for you. You can also choose to get the reports in Excel or PDF format directly in your email.
Step 5: Enable Self-Service Reporting
EasyReports also allows users to see reports on their own without waiting for someone else to prepare them. With self-service reporting, your team can check updated financial information instantly and make quicker decisions.
Whether you’re a manufacturer, trader, distributor, retailer, or service provider in India, automating financial reports helps you reduce manual work, improve reporting accuracy, and make better business decisions.
Ready to make it happen? Start your free trial with EasyReports or get the demo now and see how quickly you can automate financial reports for small business without the usual headaches.
Frequently Asked Questions (FAQs)
1. Why should small businesses in India automate financial reports?
Automating financial reports helps small businesses in India save time, reduce manual errors, improve reporting accuracy, and gain real-time visibility into their financial performance. It also enables faster decision-making and improves overall business efficiency.
2. How can small businesses in India automate financial reports?
Small businesses in India can automate financial reports by connecting their ERP systems, such as Tally, SAP Business One, Microsoft Dynamics NAV, or Business Central, with a BI reporting tool like EasyReports. The system automatically generates financial statements, dashboards, and MIS reports without manual data exports.
3. Can I automate financial reports directly from Tally?
Yes. Businesses using Tally Prime or Tally ERP can automate financial reports by integrating Tally with EasyReports. The solution reads data directly from Tally, eliminates manual Excel exports, and generates real-time financial reports.
4. Which financial reports should every small business in India monitor?
Every small business in India should regularly monitor key financial reports, including the Profit & Loss Statement, Balance Sheet, Cash Flow Statement, Budget vs Actual Report, and MIS Reports. These reports help business owners track financial performance and make informed decisions.
5. How does EasyReports help automate financial reporting?
EasyReports integrates with Tally, SAP Business One, Microsoft Dynamics NAV, Business Central, and other ERP systems. It automatically maps ledgers, provides ready-to-use financial report templates, and allows businesses to schedule reports in Excel or PDF format.
6. Do I need technical knowledge to use EasyReports?
No. EasyReports features a user-friendly drag-and-drop interface and pre-built report templates, allowing finance teams and business users to automate financial reporting without coding or advanced technical skills.
7. Can financial reports be scheduled automatically?
Yes. EasyReports allows businesses to schedule financial reports daily, weekly, monthly, quarterly, or annually. Reports can be generated automatically and delivered in Excel or PDF format, reducing manual effort and ensuring timely reporting.