
November 27, 2020
How to make business reports with reporting tool? Creating business reports with a reporting tool is the fastest way to convert raw data into meaningful insights without spending hours in Excel. A good reporting tool helps you present data visually, automate reporting, and make better data-driven decisions.
What Is a Business Reporting Tool?
A reporting tool is software designed to convert business data into readable formats like charts, dashboards, pivot tables, and downloadable reports. Unlike spreadsheets, reporting tools automate data extraction, formatting, scheduling, and visualization.
Why Do Business Reports Matter?
Business reports:
- Turn data into actionable insights
- Help companies take faster decisions
- Highlight trends, risks, and opportunities
- Improve team alignment and productivity
But let’s be honest most reports are boring. Long spreadsheets, static graphs, and endless rows of numbers don’t inspire change.
So how do you turn boring reports into engaging insights?
→ Use a reporting tool that automates, visualizes, and customizes your reports.
How to Make Business Reports with a Reporting Tool (Step-by-Step)
Step 1: Identify the Report Requirement
Ask:
- What is the goal of this report?
- Who will read it?
- What decisions will it support?
Step 2: Connect Your Data Source
Reporting tools like EasyReports connect directly to:
- Tally ERP
- SAP
- SQL databases
- Excel
- Other ERP systems
No manual exporting required.
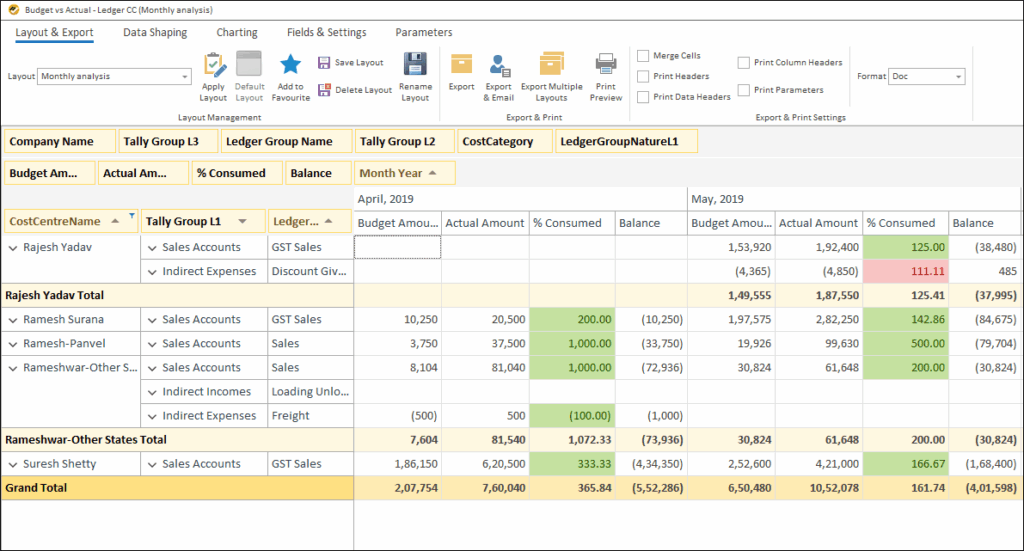
Step 3: Select the Report Format
Use:
- Grid reports
- Pivot tables
- Dashboards
- Visual charts
- PDF summaries

Step 4: Customize & Add Metrics
With EasyReports you can:
- Add custom fields (e.g. salesperson, budget)
- Apply filters, grouping, comparisons
- Create calculations like YoY or MoM
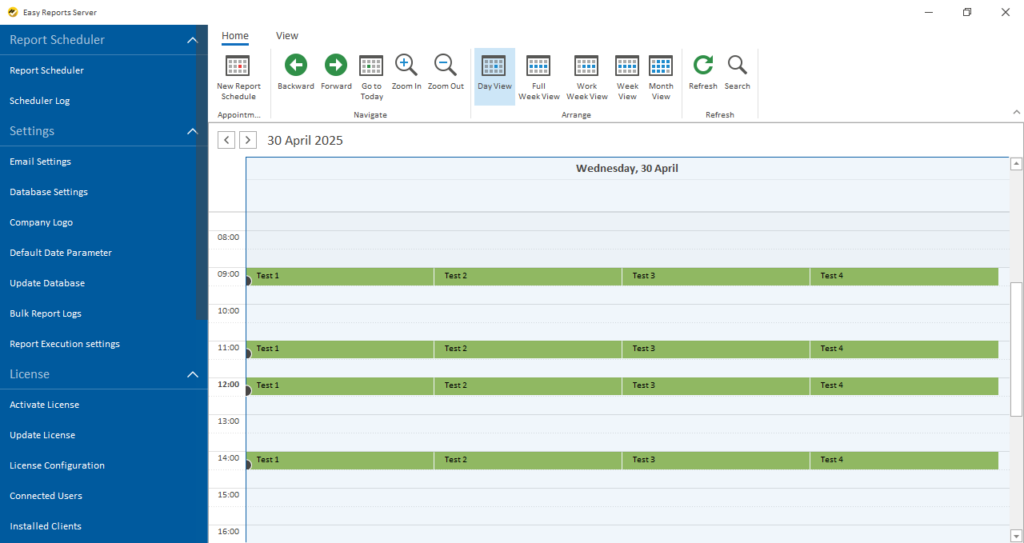
Step 5: Automate & Schedule
Set your tool to deliver reports:
- Daily
- Weekly
- Monthly
- Custom intervals (auto-delivery via email)
Example: Why Visual Reports Work Better
Think of weather reports on TV. The same data shown as charts, colors, and visuals becomes engaging and easy to understand. Business reports work the same way.
Benefits of Using EasyReports for Business Reporting
- Zero coding knowledge required
- Drag-and-drop report builder
- Integrates with Tally without Excel export
- Auto-sync & auto-scheduling
- 99+ templates for financial, sales, MIS & management reports
- Dashboard conversion with graphs & charts
- Multi-company and multi-year comparison
- Saves time, increases accuracy, and improves business decisions
Get your demo now or contact us here.
People Also Ask (FAQ Section)
I) How can I automate business reports?
Use a reporting tool like EasyReports to connect your ERP, apply templates, and schedule automatic delivery.
II) Can reporting tools replace Excel?
Not entirely — but they reduce manual work. Reporting tools automate data extraction, formatting, and scheduling while still allowing Excel export.
III) What is the best way to visualize business data?
Dashboards, pivot tables, charts, and KPI-based visuals help make data easier to understand and act on.
IV) How do I create customized business reports?
Choose a tool that supports custom fields, layouts, and user-defined calculations like EasyReports.