January 14, 2021
The people of an organization and their data are the TWO main ASSETS that organization’s nowadays focuses on. Business intelligence helps in transforming data into actionable insights that assists the management of the organization in arriving at strategic and tactical business decisions. Reporting is a central feature of business intelligence whereas the dashboard feature acts as the archetype BI tool. These tools analyze data in reports, summaries, dashboards, graphs and charts to provide the users with detailed reports about the state of the concerned business houses.
Say for example, there is an organization that deals in supply chain management business and wants to work towards the betterment needs BI capabilities to determine as to where delays are occurring, how to get rid of the issues and where variability exist within the shipping process. In this blog we will dive into How you can evaluate your profit and performance with a BI tool.
In the past, IT professionals had been the primary users of BI applications but nowadays at its been used even by the top management of the organizations for taking fat and quick decisions for better productivity.

Evaluating a BI Tool
Not all BI tools work well with all organizations. At times, BI tools need to be customized as per the needs of the business. Some companies lack BI experience in their decision-making processes when implementing enterprise systems, such as Enterprise Resource Planning (ERP), Customer Relationship Management (CRM), and Supply Chain Management (SCM).
There are many factors for BI evaluation of which the keys to self-service BI success are business intelligence dashboards and User Interfaces that include pull-down menus and self-generated drill-down points that allow users to find and transform data in easy-to-understand ways.
Basically there are 2 major factors that determines the entire evaluation process of the BI tool – Revenue and Cost.
Revenue Aspect of the evaluation process
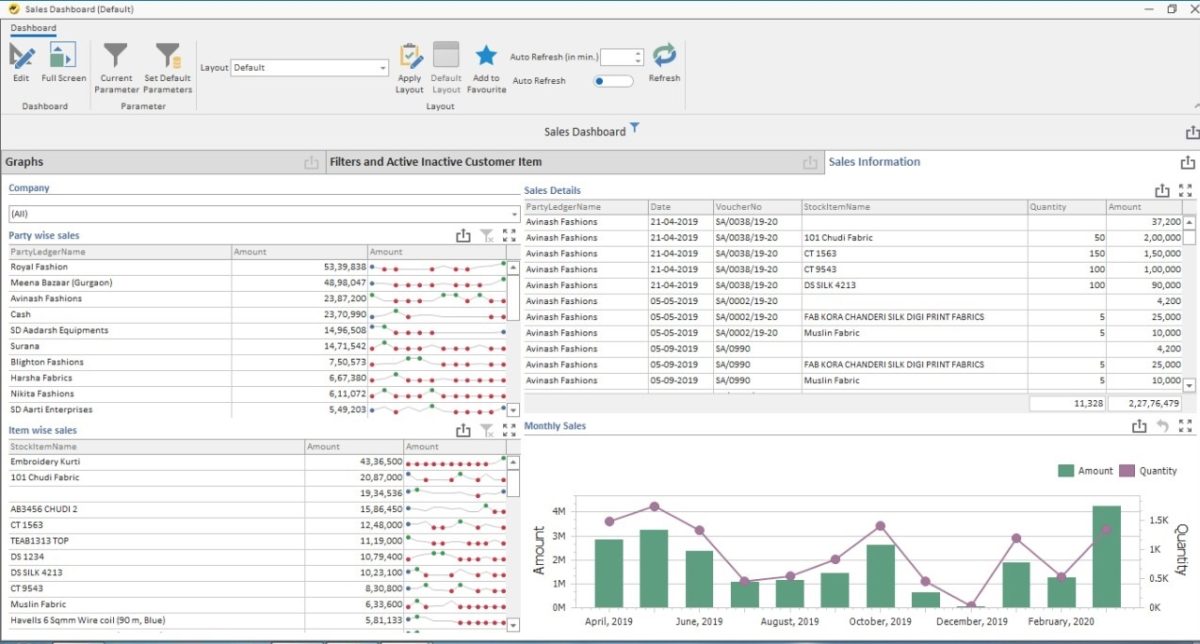
I. Sales Detailed Analysis – Detailed analysis of sales with Customer Group, Stock Group, etc. for the period.
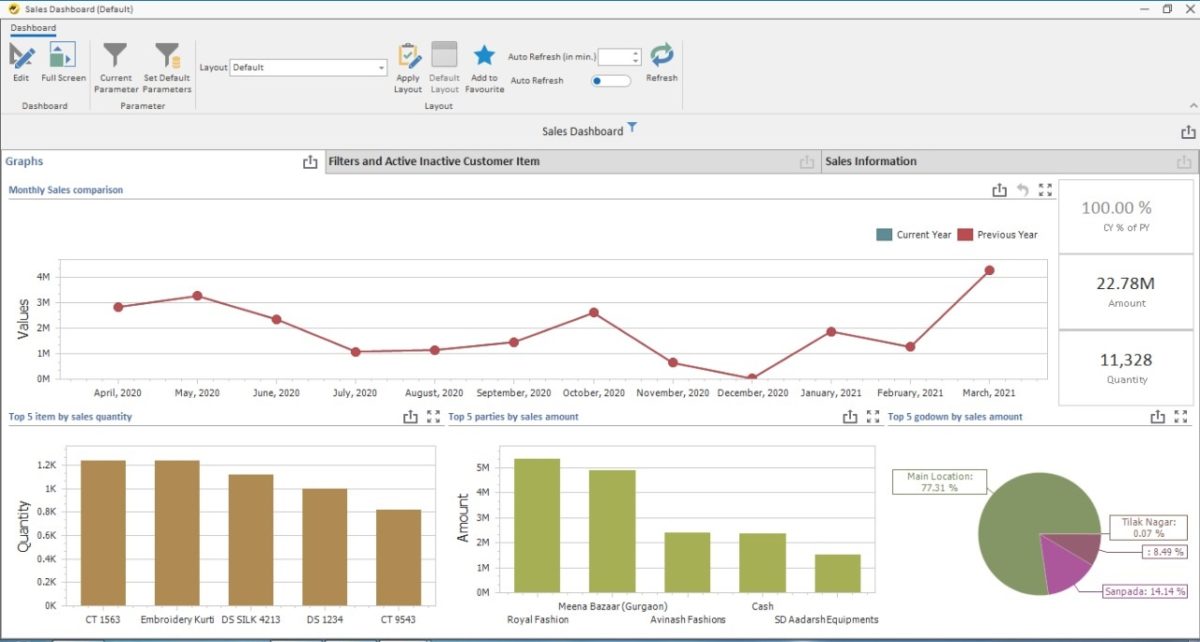
II. Sales Comparison Year / Month Wise – Sales comparison statement year / month wise for the period
III. Sales Order Tracking – Shows all sales order for the selected period along with delivered quantity, invoice quantity and pending quantity.
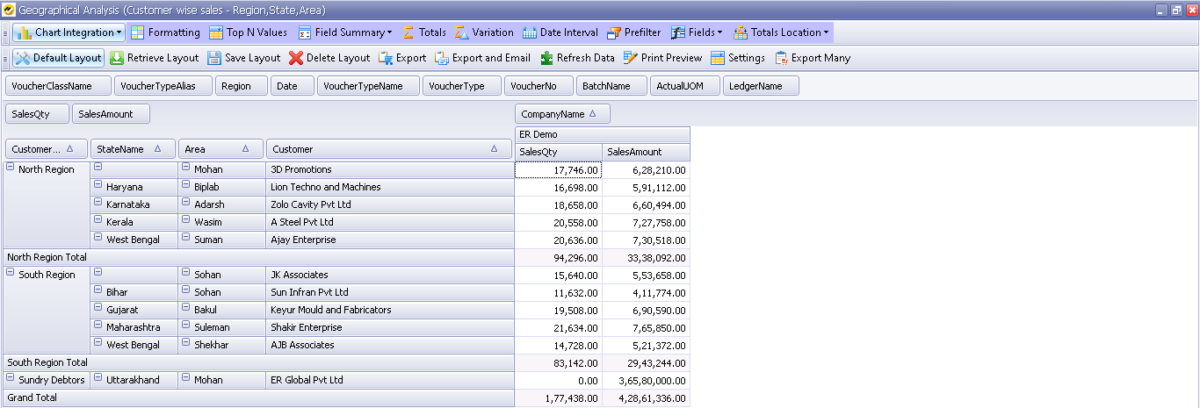
IV. Geographical Analysis – This report shows region, state, area, godown wise sales for the selected period.
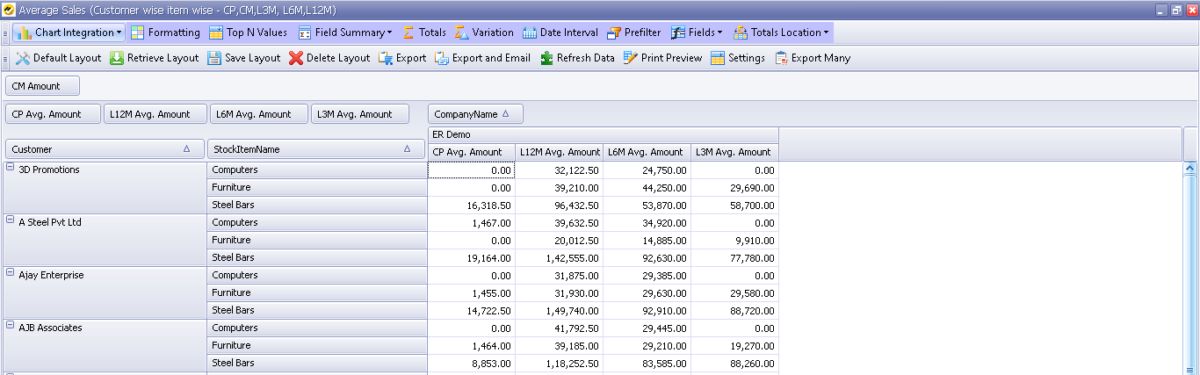
V. Average Sales – This report displays selected period average sales comparison with L3M, L6M, L12M average sales, customer and item wise.
Cost Aspect of the evaluation process
I. Cost Centre PL – This report will help the management to know Income and Expenses incurred by each cost centre. It helps in identifying which cost centers are profitable and which are not. Based on this the management can take corrective actions for loss making areas.
Purchase
I. Average Purchase – This report displays selected period average purchase comparison with L3M, L6M, L12M average purchase, customer and item wise.

II. Purchase Detailed Analysis – This report displays the purchase with Party Group, Stock Group, Stock Category, etc for the periods
III. Purchase Comparison Month / Year Wise – Monthly / yearly purchase comparison statement for the period
Inventory
I. Reorder Level Details – This report shows closing stock with reorder level, minimum stock level and shortfall or excess
II. Sales Orders Due / Overdue – Shows all sales orders which are due or overdue as on selected date along with age wise analysis
III. Inventory Movement – Shows movement of inventory for the selected period. It shows item wise opening, purchase, manufacturing, sales, sales cost, margin and closing.
Profit Reports
I. Gross Margin – Gross margin helps you identify item wise profitability. It helps in identifying the item with high profit margin along with loss making items.
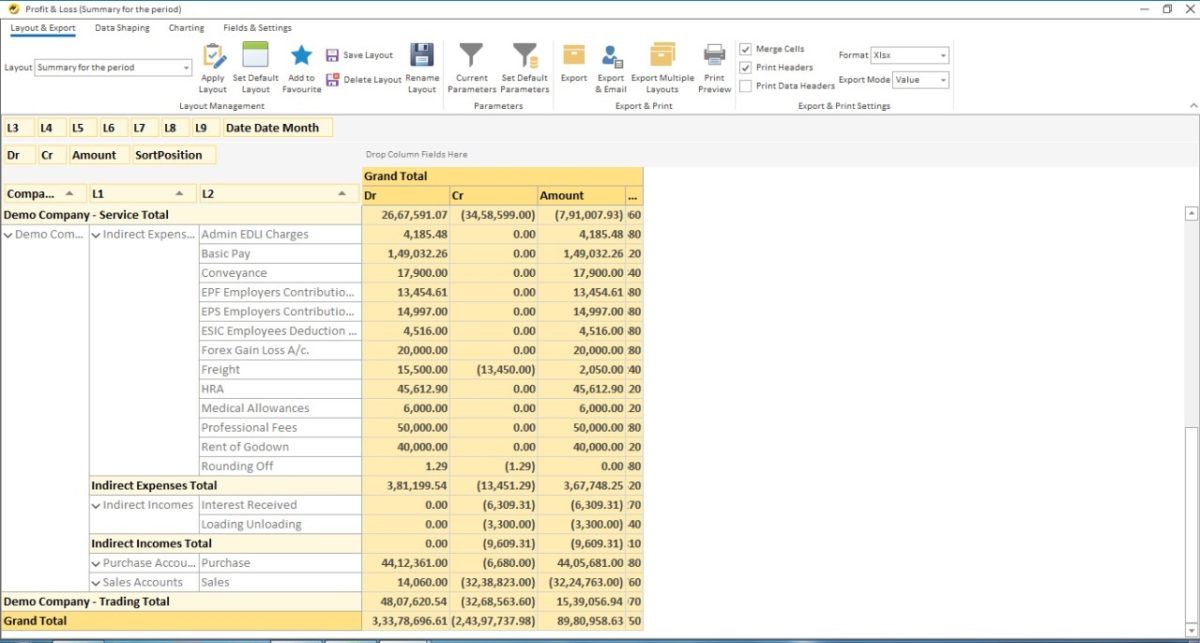
II. Profit & Loss – Profit & Loss statement is a financial statement that summarizes the revenue, costs and expenses incurred during a specified period, generally for a quarter or a financial or fiscal year.
This is how you can evaluate your profit and performance with a BI tool ensuring data-driven decision-making for business growth.